
30 Nov Tech Talk – What Is Inflation?
Inflation is a rise in the general level of prices of goods and services in an economy over a period of time. It is measured as an annual percentage increase. When inflation rises, every dollar buys a smaller amount of goods and services. The value of money falls. Causes of inflation can be many but typically stem from increased demand (too much money chasing too few goods) or increased costs to produce items (such as higher oil prices).
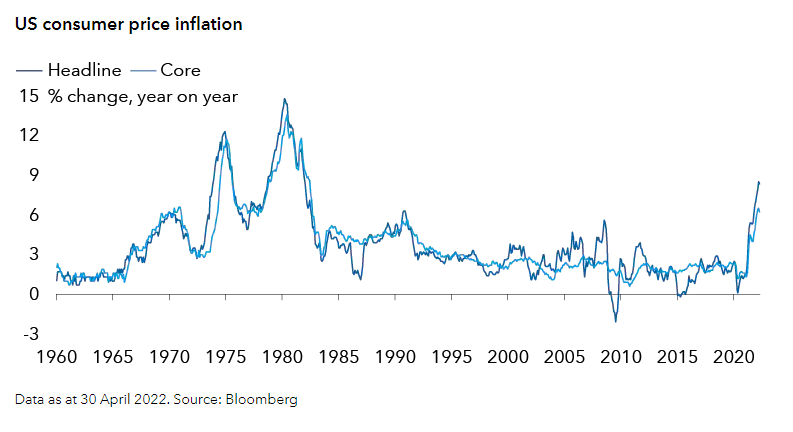
The conflict in Ukraine has delivered a commodity price shock similar to that of the early 1970s, shattering hopes that the inflationary uptick may prove to be transitory. As inflation reaches multi-decade highs, we analyse what is driving inflation across the world and consider what central banks need to do to get inflation back to target levels.
As we consider how inflation will evolve in the coming months and years, it is helpful to understand past inflation cycles and how they impacted investments.
In general, there have been four primary causes of inflation, some of which overlap (see table below):
Excess money supply growth – Too much money chasing too few goods. Money supply growth leads to more bank lending resulting in faster economic growth.
High resource utilisation rates – Utilisation rates going persistently above 80% has been the approximate historic dividing line between rising and falling inflation in the US.
Price shocks – Cost-push inflation may be driven by energy prices, other input price increases, supply chain disruptions or currency declines.
Inflation expectations – Inflation can be integrated into the economic system if participants start to assume that prices will always increase, usually via wage increases and long-term contracts.
 Source: Capital Group
While there are sufficient differences in terms of the drivers and the market environment, it is difficult to make strong conclusions about what might happen in future periods of inflation. Inflation is complex and the drivers and effects have changed not only with each episode but also within the episode.
What does history teach us?
A brief history of inflationary episodes
1966-1970 – The early/mid-1960s was a period of accelerating government spending and accelerating money supply growth, which supported rapid bank lending. This caused consumer and corporate demand to grow at more than 6% p.a. for five years and ultimately led to resource utilisation exceeding 90%.
1973-1975 – The Middle Eastern energy crisis drove oil prices up 184% in 1973-74. Companies were unable to absorb such a cost increase in their profit margins, so they passed this on to consumers. Since this was a period of high unionisation, wage increases accelerated, leading to rising inflation expectations.
1978-1980 – Similar to 1973-75, except that oil prices almost quadrupled during 1980.
1987-1991 – Increases in resource utilisation and the declining US dollar led to inflationary pressures. The spike in oil prices around the first Gulf War caused a further increase in inflation.
1999-2001 – Resource utilisation was high (evidenced by an unemployment rate below 4%) and oil prices almost tripled.
2004-2006 – Monetary policy was highly accommodative, resource utilisation rose, oil prices went up almost four times and the US dollar declined.
2010-2012 – Commodity prices increased and the US dollar declined.
2021-current – Pandemic-related fiscal stimulus fuelled very strong demand which exacerbated the impact of supply-chain disruptions caused by COVID-19 lockdowns. The recent surge in commodity prices from the Russia/Ukraine conflict has amplified the acceleration in inflation that we have been seeing globally. Both Russia and Ukraine are important food commodity exporters, with Russia and Ukraine accounting for roughly 30% of the world’s wheat exports. Russia is also an important exporter of nickel, palladium, and titanium.
What is driving inflation around the world?
In general, there are two types of inflation. Sticky inflation tends to have longer staying power. Sticky categories include rent, wages, insurance and medical expenses. Flexible inflation on the other hand, which is more volatile, affects items such as food, energy and cars and tends to result from demand/supply imbalances. Commodity prices have risen much faster in recent months, mainly due to the Russia-Ukraine conflict which created a significant negative supply shock, as both countries are large commodity exporters. The rise in food and energy prices will not only put pressure on overall inflation but may also lead to inflation inequality, as lower income households dedicate a higher percentage of their income to necessities. However, it is important to note that unlike the 1970s, long-term inflation expectations have remained relatively anchored so far. For example, in the US markets expect long-term inflation to be at around 2.6%.
United States
The main drivers of US inflation are currently:
– Demand/supply imbalances as a result of the pandemic-related shutdown followed by a strong economic rebound.
– A tight labour market which is driving wage growth.
– Rising rents due to low levels of housing stock and vacant rental units.
– Supply shortages, specifically semiconductors and microchips, are hurting the production of new cars, pushing up new and used car prices.
– Health care costs are also picking up.
Europe (ex UK)
The main drivers of inflation in this region are:
– Demand/supply imbalances, heightened by supply bottlenecks.
– Higher energy prices, which have been amplified by the Russia/Ukraine conflict and are still feeding through to consumers.
– Wage growth remains muted compared to the US and UK, although workers are finally starting to see higher settlements.
United Kingdom
The main drivers of UK inflation are:
– Demand/supply imbalances, which have been further exacerbated by Brexit.
– Labour shortages, which have been amplified by Brexit and people leaving the workforce and the country during the pandemic, are driving wage growth.
Emerging markets (ex China)
The main drivers of emerging markets (EM) inflation outside of China are:
– Rising food prices. Food is the single largest component of inflation baskets in many EM countries, accounting for roughly 25% of the CPI basket on average, and up to 50% in countries such as India. However, some EM countries, particularly in Latin America, have been somewhat shielded from the rise in global food prices as they produce much of their food locally and in some cases are less dependent on wheat/grain.
– The impact of higher energy prices is even more uneven. Most EM countries are net oil importers, with the largest being Ukraine, Hungary, South Africa, India and Poland. On the other hand, the key beneficiaries of higher oil prices are Russia, Venezuela and Ghana.
– The pass-through from weaker exchange rates to inflation, especially for countries that are large importers.
China
China does not currently have an inflation problem. The economy is slowing on many levels: the property crash, their zero-COVID policy and longer term issues such as demographics. This could easily be disinflationary but, in the short to medium term, supply chain issues will get exacerbated by the factory and port shutdowns.
The People’s Bank of China has already started loosening monetary policy to support growth but, to date, the size of the cuts in the Reserve Requirement Ratio have been very small. While we expect more significant loosening in Q2 2022, this will only impact growth in 2023 given easing acts with a lag. We see more room for using monetary policy easing rather than fiscal easing, although there is a question mark on how the economy will react to monetary easing without limited fiscal support.
The path of inflation is difficult to predict
Central banks expected a “transitory” uptick in inflation as the global economy recovered from the pandemic, but the Russia/Ukraine conflict has shattered those assumptions. The short/medium-term inflation outlook is particularly uncertain due to factors such as China suppressing its largest wave of COVID-19 infections since the start of the pandemic and commodity prices easing slightly on speculation that slowdown in China’s economy may dampen demand. The longer outlook is also uncertain due to key secular forces including technology, debt and demographics remaining disinflationary. However, with governments and companies now deprioritising efficiency over resilience, a significant reengineering of supply chains along strategic lines might take place which could make inflation both persistent and unpredictable.
Conclusion
Inflation is incredibly hard to predict, much depends on how committed central banks will be to containing inflation close to target. Getting there could involve some economic turmoil (raising rates), so it is possible that central banks capitulate, and that we end up with medium/longer term inflation that is above target. Even if they remain committed to containing inflation, they could still conclude that structural factors, e.g. increasing geopolitical polarisation that impacts trade relationships and supply chains, are preventing them from getting inflation back to target without imposing an unacceptable cost to the economy, and thus simply move the target rate higher.
This article was originally produced by Flavio Carpenzano and Andy Budden, Investment Director from Capital Group. You can read the full article here.
Next Steps
To find out more about how a financial adviser can help, speak to us to get you moving in the right direction.
Important information and disclaimer
The information provided in this document is general information only and does not constitute personal advice. It has been prepared without taking into account any of your individual objectives, financial solutions or needs. Before acting on this information you should consider its appropriateness, having regard to your own objectives, financial situation and needs. You should read the relevant Product Disclosure Statements and seek personal advice from a qualified financial adviser. From time to time we may send you informative updates and details of the range of services we can provide.
FinPeak Advisers ABN 20 412 206 738 is a Corporate Authorised Representative No. 1249766 of Spark Advisers Australia Pty Ltd ABN 34 122 486 935 AFSL No. 458254 (a subsidiary of Spark FG ABN 15 621 553 786)
No Comments