
16 Apr Monthly Commentary: March 2024
Market Trends: Shares rally, but valuations look stretched
Easing fears of a global recession remained the major global market theme in February, with the US Federal Reserve signalling the next move in rates is likely down. The only near-term debate is how quickly the Fed will cut, with markets potentially at risk in the short term if the Fed delays until later this year or even early 2025.
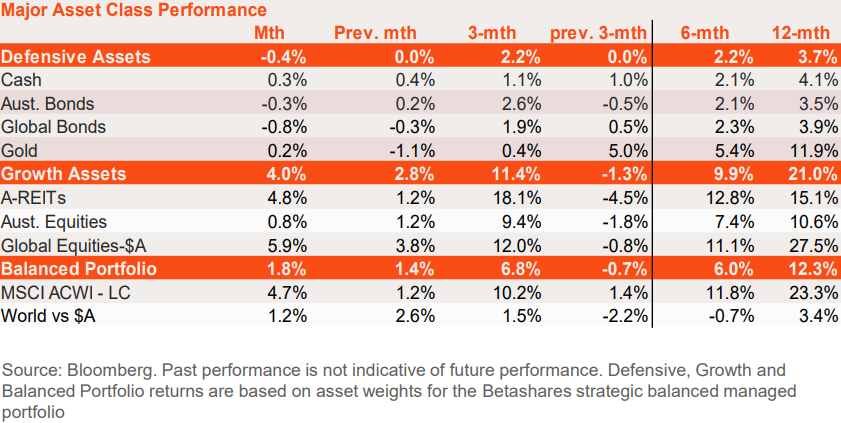
Betashares’ hypothetical balanced portfolio returned 1.8% in February, reflecting gains in growth assets more than offsetting a small decline in defensive asset returns.
Defensive asset returns were down 0.4%, reflecting weaker fixed-rate bond returns. In turn this reflected a rise in local and global bond yields as resilient economic data and an upside surprise to US inflation caused markets to push out the timing of expected central bank rate cuts.
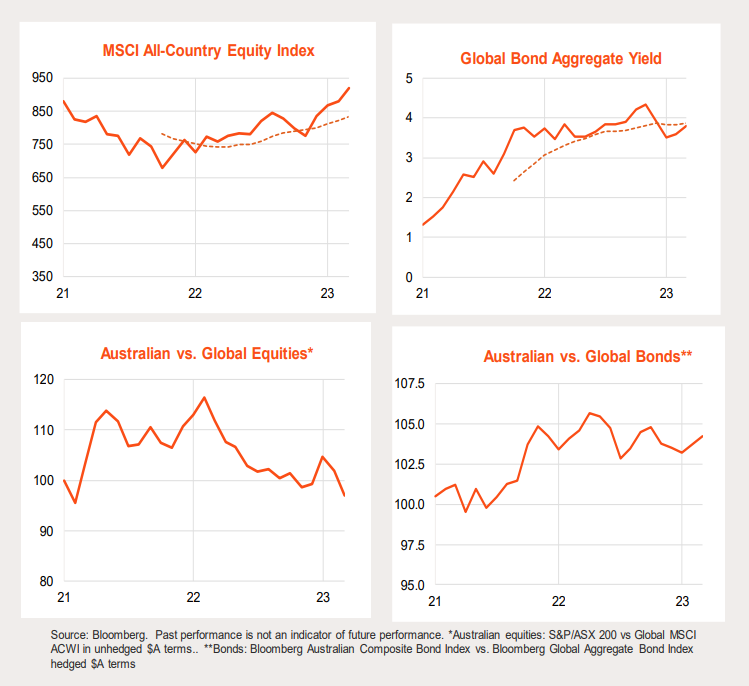
Growth assets returned 4.0%, with global equities in unhedged AUD terms rising 5.9%. Global equities have been trending upward since late 2022, but the PE ratio and equity risk premium appear a little stretched by recent historic standards.
Despite higher bond yields, local listed property returned a solid 4.8%, while Australian equities returned a more modest 0.8%. The trend in the relative performance of Australian equities has remained downward since early 2023. Relative returns for Australian versus global bonds has been choppy over the past year.
Market overview – February 2024
Global & Australia Major Asset Class Performance
Global Bonds
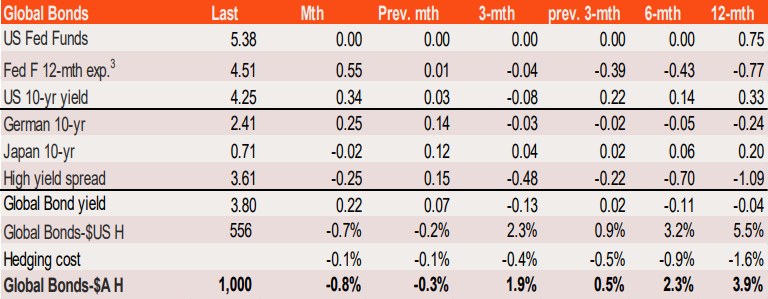
The Bloomberg Global Aggregate Bond Index ($A hedged) lost 0.8% in February, reflecting a lift in global bond yields as a higher-than-expected US January CPI result pushed out market timing for the first US official interest rate cut. Over the past year, the index has returned 3.9%
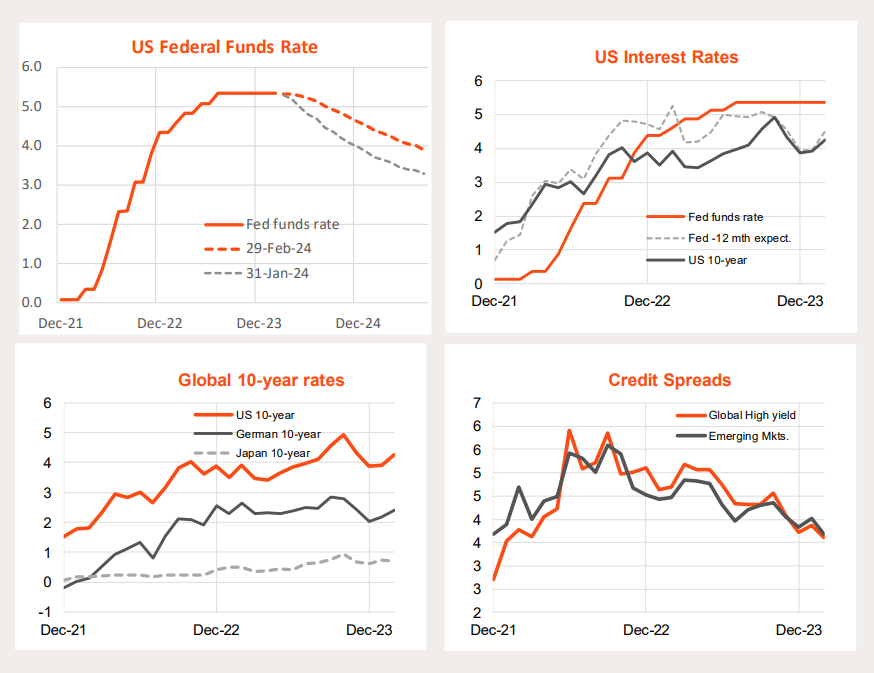
The core US CPI rose 0.4% in January, a touch higher than the 0.3% market expectation. Together with a higher-than-expected producer price index (PPI) and still solid US activity data, markets effectively halved the number of expected 0.25% US rate cuts this year from six to three. US 10-year bond yields rose 0.34% to 4.25%.
Outside of the US, German 10-year yields also moved higher while Japanese yields were steady. High yield bond spreads narrowed after an uptick in January. All up, the yield-to-maturity on the Bloomberg Global Aggregate Index lifted 0.22% to 3.8%.
Select Global Interest Rates
Source: Bloomberg, Refintiv, Betashares. Past performance is not indicative of future performance.
Australian Cash & Bonds
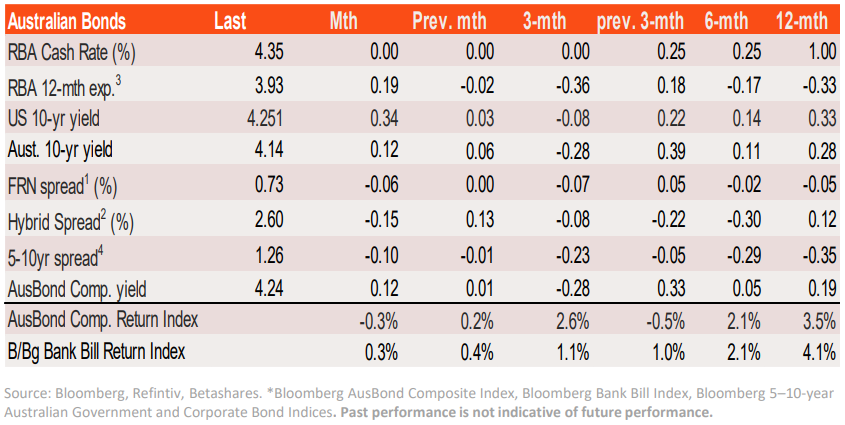
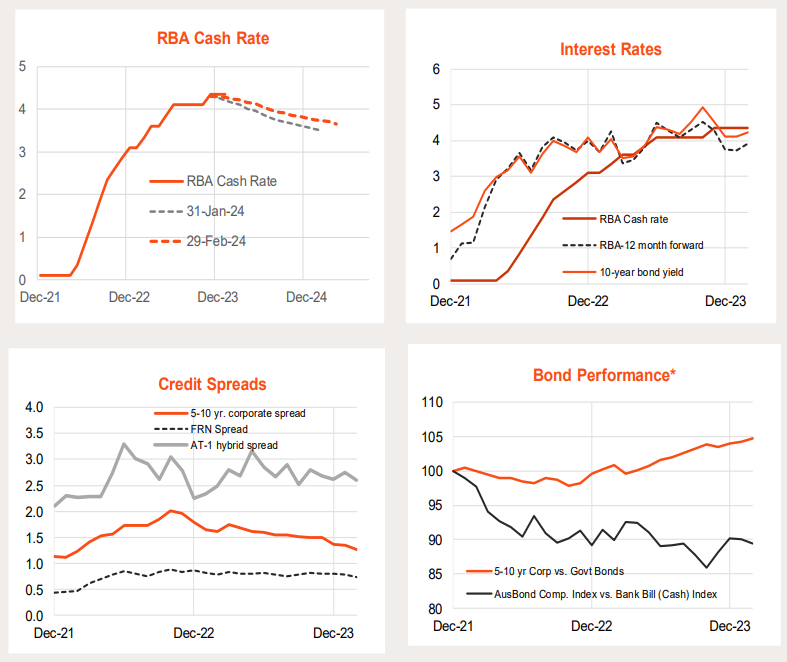
The Bloomberg Australian Bond Composite Index lost 0.3% in February, reflecting a lift in local bonds yields. Cash returns, according to the Bloomberg Bank Bill Index, lifted 0.3%.
The gain in bond yields reflected both higher global rates plus a push back in the timing of local official rate cuts. The market is pricing just under two rate cuts over the next 12-months, from almost three rate cuts expected at end-January.
Bond have outperformed cash since the peak in bond yields in October last year, though there has been a modest setback in this trend in the past two months.
Corporate credit spreads, meanwhile, continue to narrow, which is supportive of corporate bond outperformance over government bonds.
Select Australian Interest Rates
Global Equities
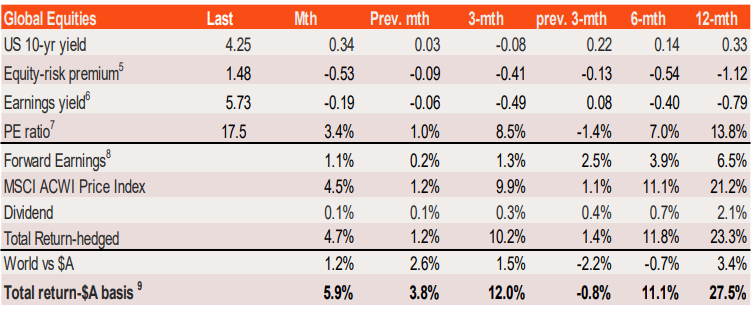
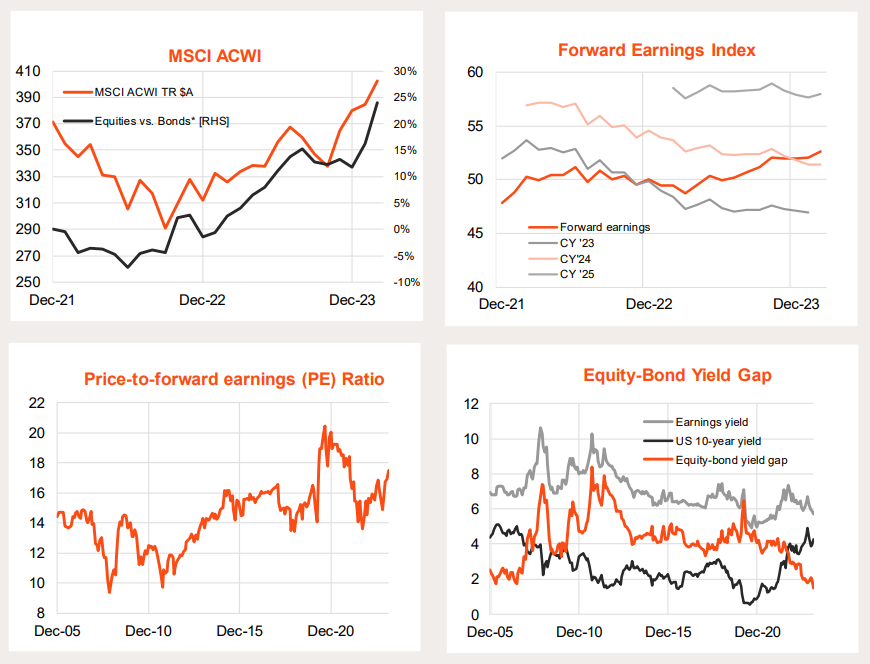
Despite the rise in global bond yields, the MSCI All-Country World Index returned 4.7% in February on an unhedged (local currency) basis, following a more modest 1.2% gain in January. Forward earnings rose 1.1%, helped by still-solid earnings growth expectations and a good US earnings reporting season. But the major driver of returns was a further narrowing in the equity-risk premium to a relatively tight 1.5%. This saw the PE ratio rise 3.4% to 17.5x.
In unhedged $A terms, global equities returned a stronger 5.9%, thanks to strength in global currencies versus the $A. On an unhedged basis, global equities have returned 27.5% over the past year.
Easing fears of a global recession remains the major global market theme, with the US Federal Reserve signalling the next move in rates is likely down. The only near-term debate is how quickly the Fed will cut, with markets potentially at risk in the short term if the Fed delays until later this year or even early 2025.
That said, at 17.5x and 1.5% respectively, the PE ratio and equity risk premium appear a little stretched by recent historic standards, suggesting further equity gains may require a decent further decline in bond yields or a lift in forward earnings.
MSCI All-Country World Equity Index
Global Sector/Factor Trends
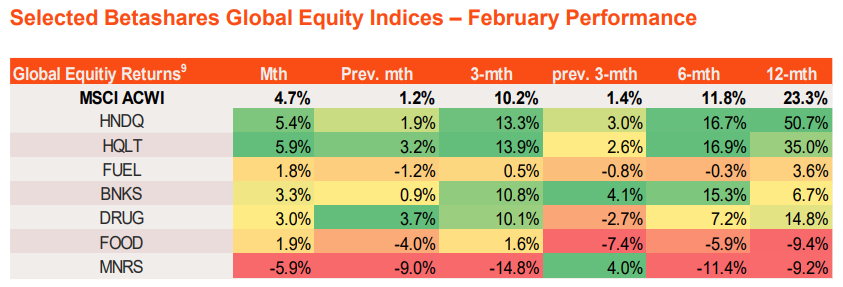
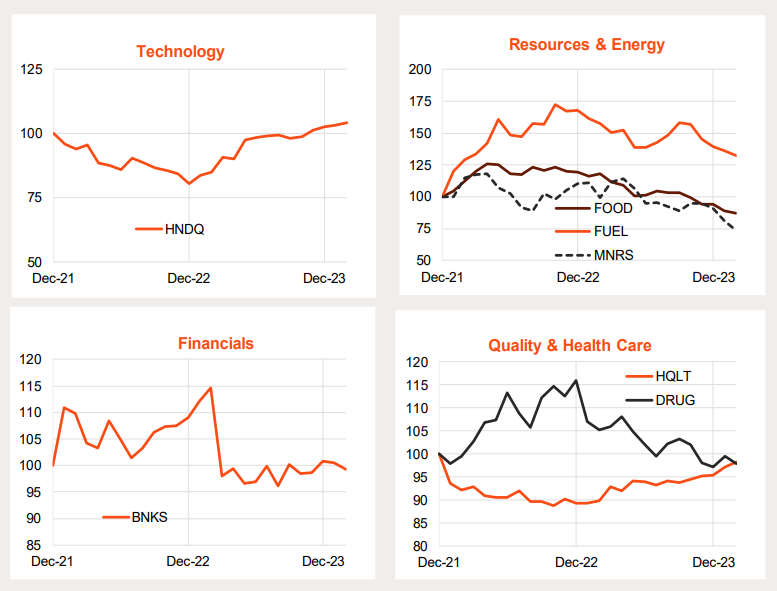
Despite rising bond yields, technology and quality were again among the best performing equity themes in February, with HNDQ’s index returning 5.4%, while HQLT’s index returned 5.9%. Strength in US technology earnings – and continued enthusiasm for artificial intelligence companies – are supporting both exposures.
Resources and energy exposures continue to underperform, along with health care. Financials (BNKS) are broadly tracking global performance.
Source: Bloomberg, Betashares. Shows the performance of the index that each ETF seeks to track, and not the ETF itself. Does not take into account ETF management fees and costs. You cannot invest directly in an index. Past performance is not indicative of future performance of any index or ETF
Selected Betashares Global Equity Index Exposures
Relative Performance Indices
Source: Bloomberg, Betashares. International ETF indices vs. MSCI ACWI. Index performance is used to show longer term performance of the exposure. Chart shows performance of the index which the relevant ETF aims to track, not the actual past performance of the ETF. Index performance does not take into account ETF fees and costs. You cannot invest directly in an index. ETF may not have been in existence for entire period specified in the chart. Past performance is not an indicator of future performance.
Global Regional Trends
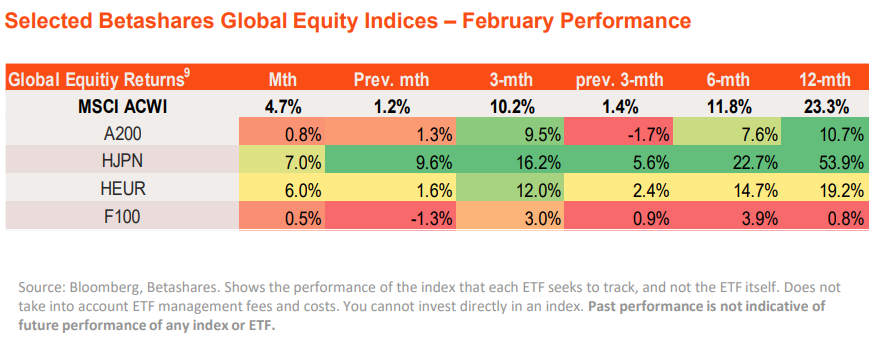
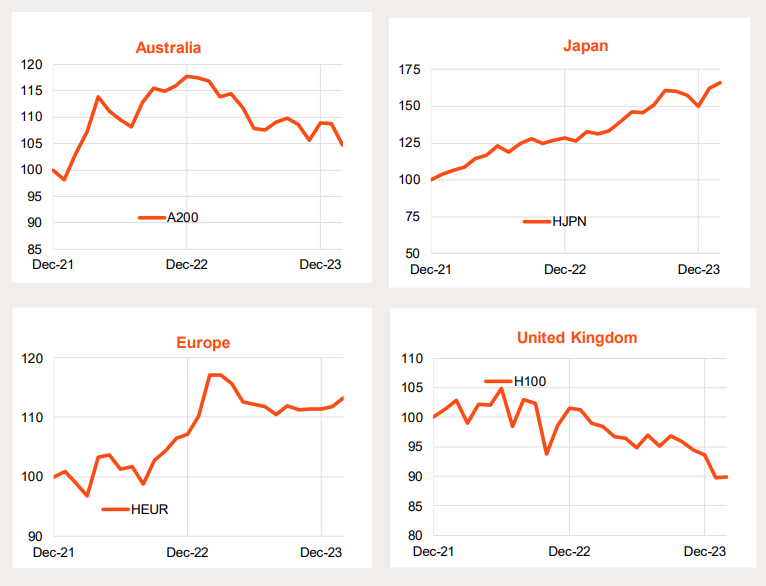
Outside of the United States and among selected major Betashares regional ETFs, Europe and Japan (HEUR and HJPN) enjoyed strong returns in February, up 6.0% and 7.0% respectively.
Broad trends over recent months continue to favour Japan, while Europe is tracking sideways in terms of relative global performance. Australia and the UK continue to generally underperform.
Selected Betashares Global Equity Index Exposures
Relative Performance Indices
Source: Bloomberg, Betashares. International ETF indices vs. MSCI ACWI. Index performance is used to show longer term performance of the exposure. Chart shows performance of the index which the relevant ETF aims to track, not the actual past performance of the ETF. Index performance does not take into account ETF fees and costs. You cannot invest directly in an index. ETF may not have been in existence for entire period specified in the chart. Past performance is not an indicator of future performance.
Australian Equities
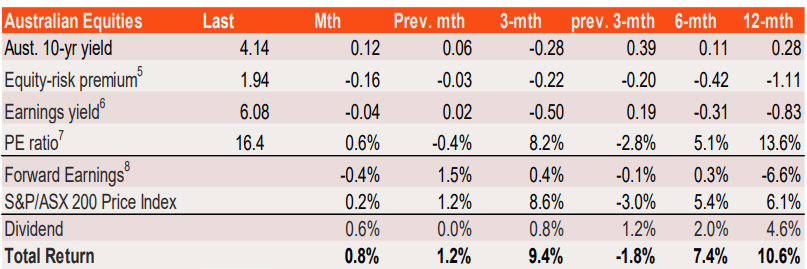
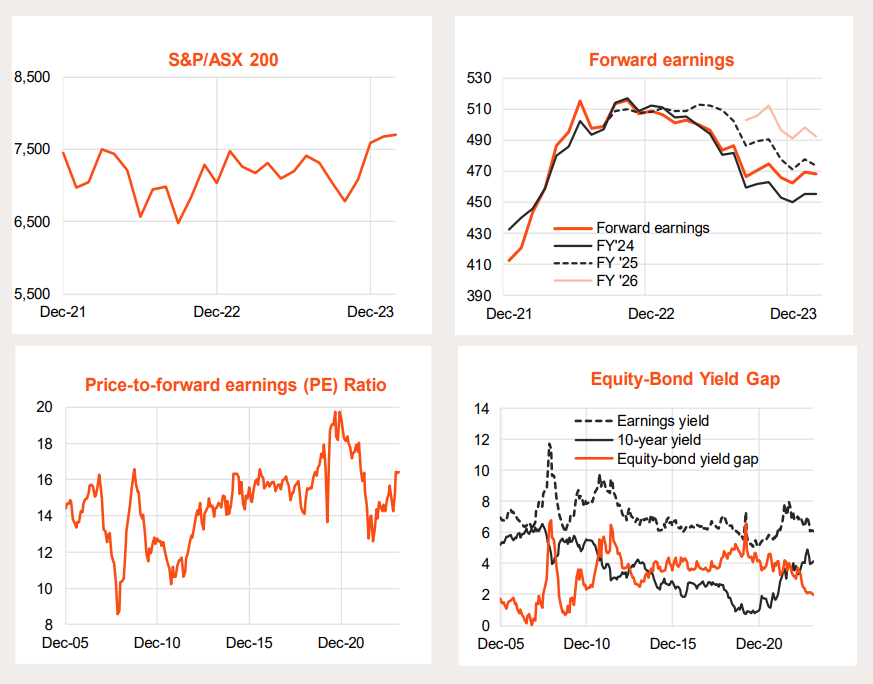
Despite the rise in bond yields, the S&P/ASX 200 Index returned 0.8% in February after a 1.2% gain in January. Forward earnings declined after rising in January, while the gain in equity prices reflected a further decline in the equity-risk premium to 1.9% hence the modest lift in the PE ratio to 16.4x.
After enduring a choppy sideways range over the past two years (with a recovery in PE valuations offset by declining forward earnings) the market has recently broken though this range to new highs. As with global markets, PE valuations are getting a little stretched and the equity-risk premium is low. Sustained further gains seem to require a decent decline in bond yields (without a recession!) or a further gain in forward earnings.
With a local and global economic soft landing now appearing more achievable, the outlook for earnings is encouraging – albeit expected growth over the coming year appears somewhat more subdued than for the global market overall.
S&P/ASX 200 Equity Index
Source: Bloomberg, Refintiv, Betashares. Past performance is not indicative of future performance.
Australian Equity Themes
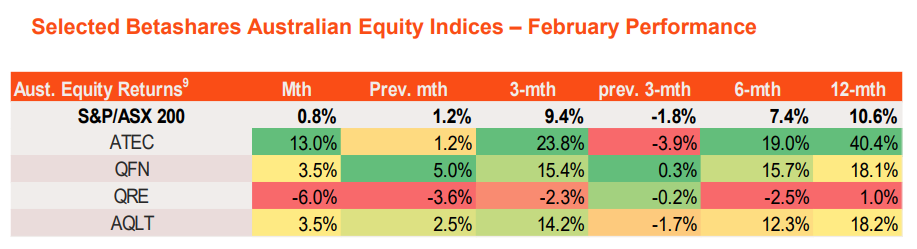
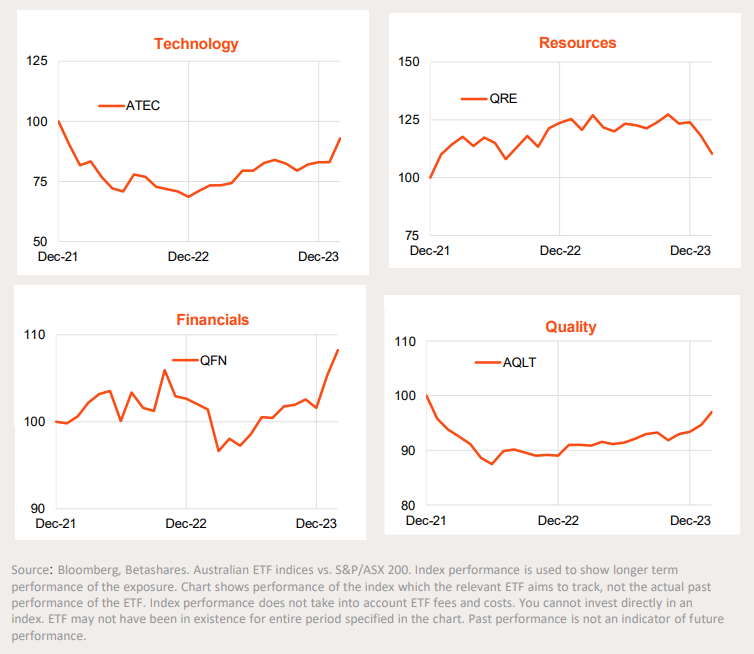
Local technology stocks had a good February, with ATEC’s index returning 13.0%. ATEC’s index is up 40.4% over the past 12 months.
By contrast, resources stocks fell in February while quality (AQLT) and financials (QFN) posted solid gains of 3.5% each.
Over the past six to 12 months, three of the selected Australian equity theme indices – financials, technology and quality – have tended to outperform the broader market. After a very strong 2022, the relative performance of the resources sector has since pulled back.
Source: Bloomberg, Betashares. Shows the performance of the index that each ETF seeks to track, and not the ETF itself. Does not take into account ETF management fees and costs. You cannot invest directly in an index. Past performance is not indicative of future performance of any index or ETF.
Selected Betashares Australian Equity Index Exposures
Relative Performance Indices
This article was originally produced by David Bassanese from BetaShares. You can read the full article here.
Next Steps
To find out more about how a financial adviser can help, speak to us to get you moving in the right direction.
Important information and disclaimer
The information provided in this document is general information only and does not constitute personal advice. It has been prepared without taking into account any of your individual objectives, financial solutions or needs. Before acting on this information you should consider its appropriateness, having regard to your own objectives, financial situation and needs. You should read the relevant Product Disclosure Statements and seek personal advice from a qualified financial adviser. From time to time we may send you informative updates and details of the range of services we can provide.
FinPeak Advisers ABN 20 412 206 738 is a Corporate Authorised Representative No. 1249766 of Spark Advisers Australia Pty Ltd ABN 34 122 486 935 AFSL No. 458254 (a subsidiary of Spark FG ABN 15 621 553 786)
No Comments