
16 Nov TECH TALK: The 80:60 Case Study
The Power of Less Downside – The 80:60 Case Study
The power of compounding is profound and well understood. What is less understood is the power of managing your downside. Too often we focus on the upside potential without due attention to the downside characteristics of investments. In this white article we examine the power of reducing the downside even when the upside may also be limited. Specifically we focus on a strategy we call 80:60, a strategy that only participates in 80% of an up month’s return and only 60% of a down month’s return. Losing less to win doesn’t sound very exciting but as we will show it can be very powerful. It has many similarities with a sporting team that has a great defence or back line. Preventing the opposing team scoring can increase your chances of winning.
The well understood mechanics of compounding
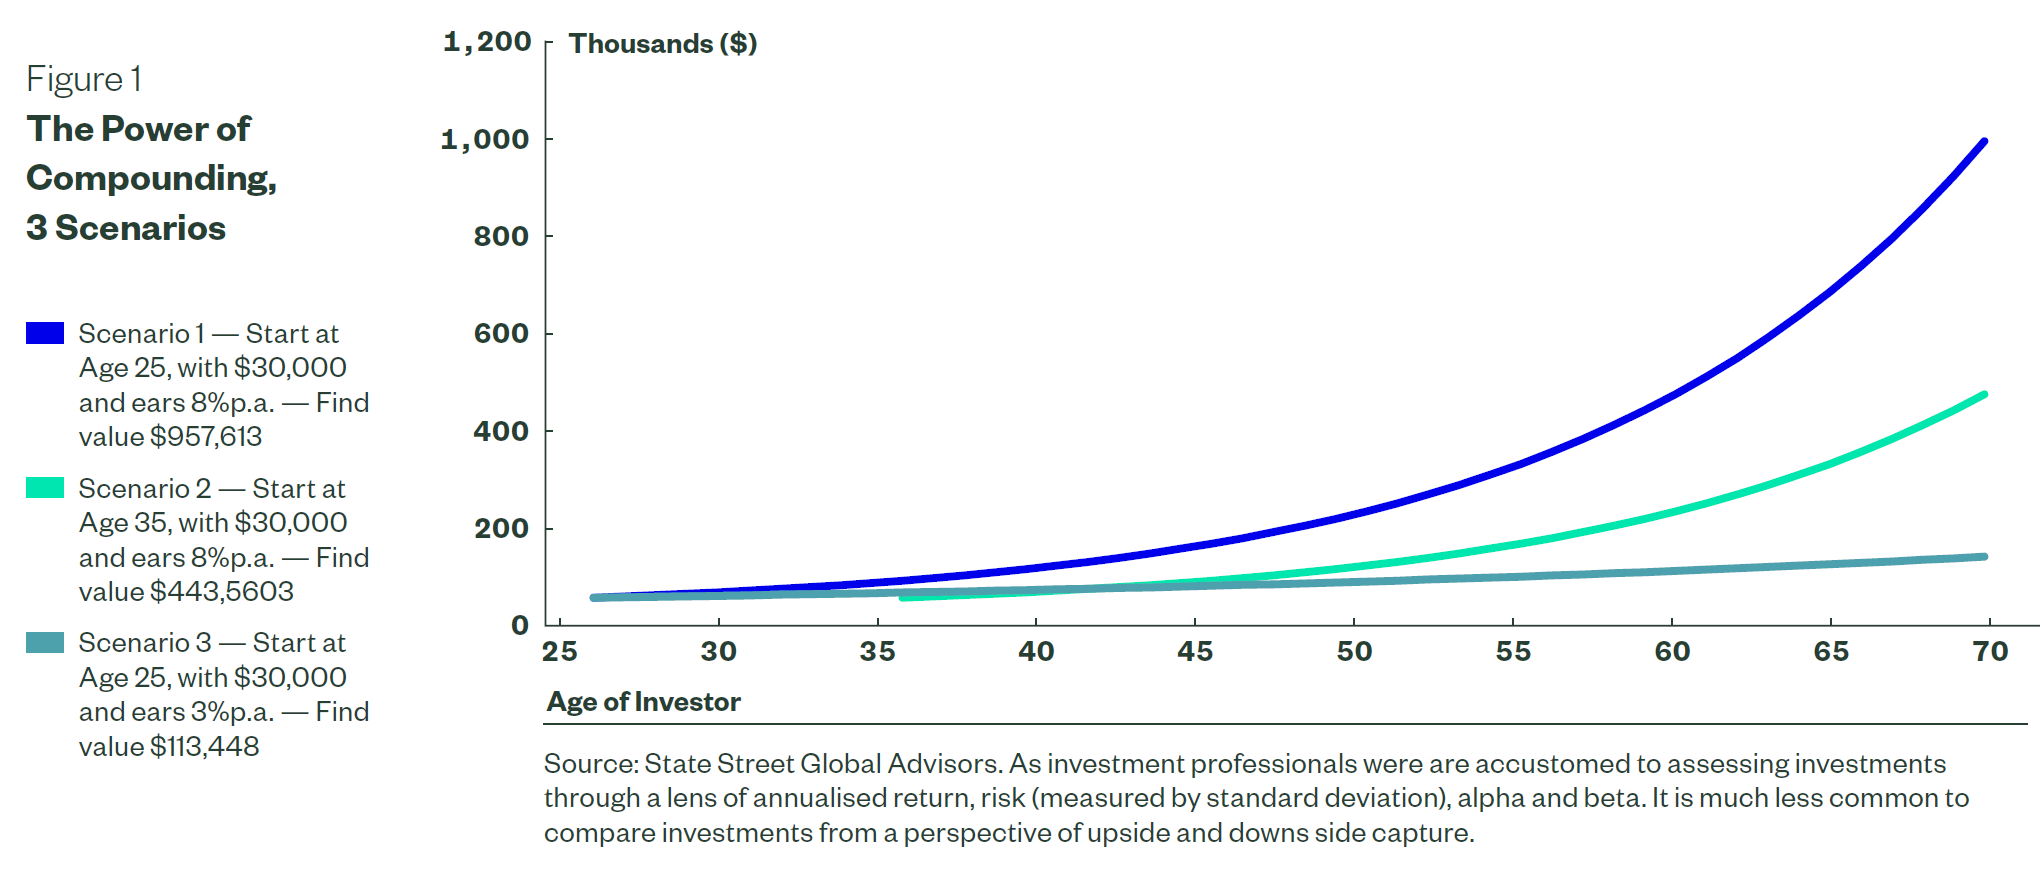
As investment professionals we are well acquainted with compounding and understand the power of accumulating wealth over a long period of time. We know that successful wealth creation requires a long term approach to investing. Those that start early and contribute throughout the period benefit the most. Figure 1 below illustrates the power of compounding. Starting 10 years earlier (scenario 1 vs scenario 2) can have twice the impact to your account balance. It’s also important to invest for growth as scenario 3 illustrates being too risk averse can also be costly.
Definition of Upside and Downside Capture
Upside/downside capture ratio’s show the degree to which a strategy has gained relative to an index during a period of market strength or lost relative to an index during a period of market weakness.
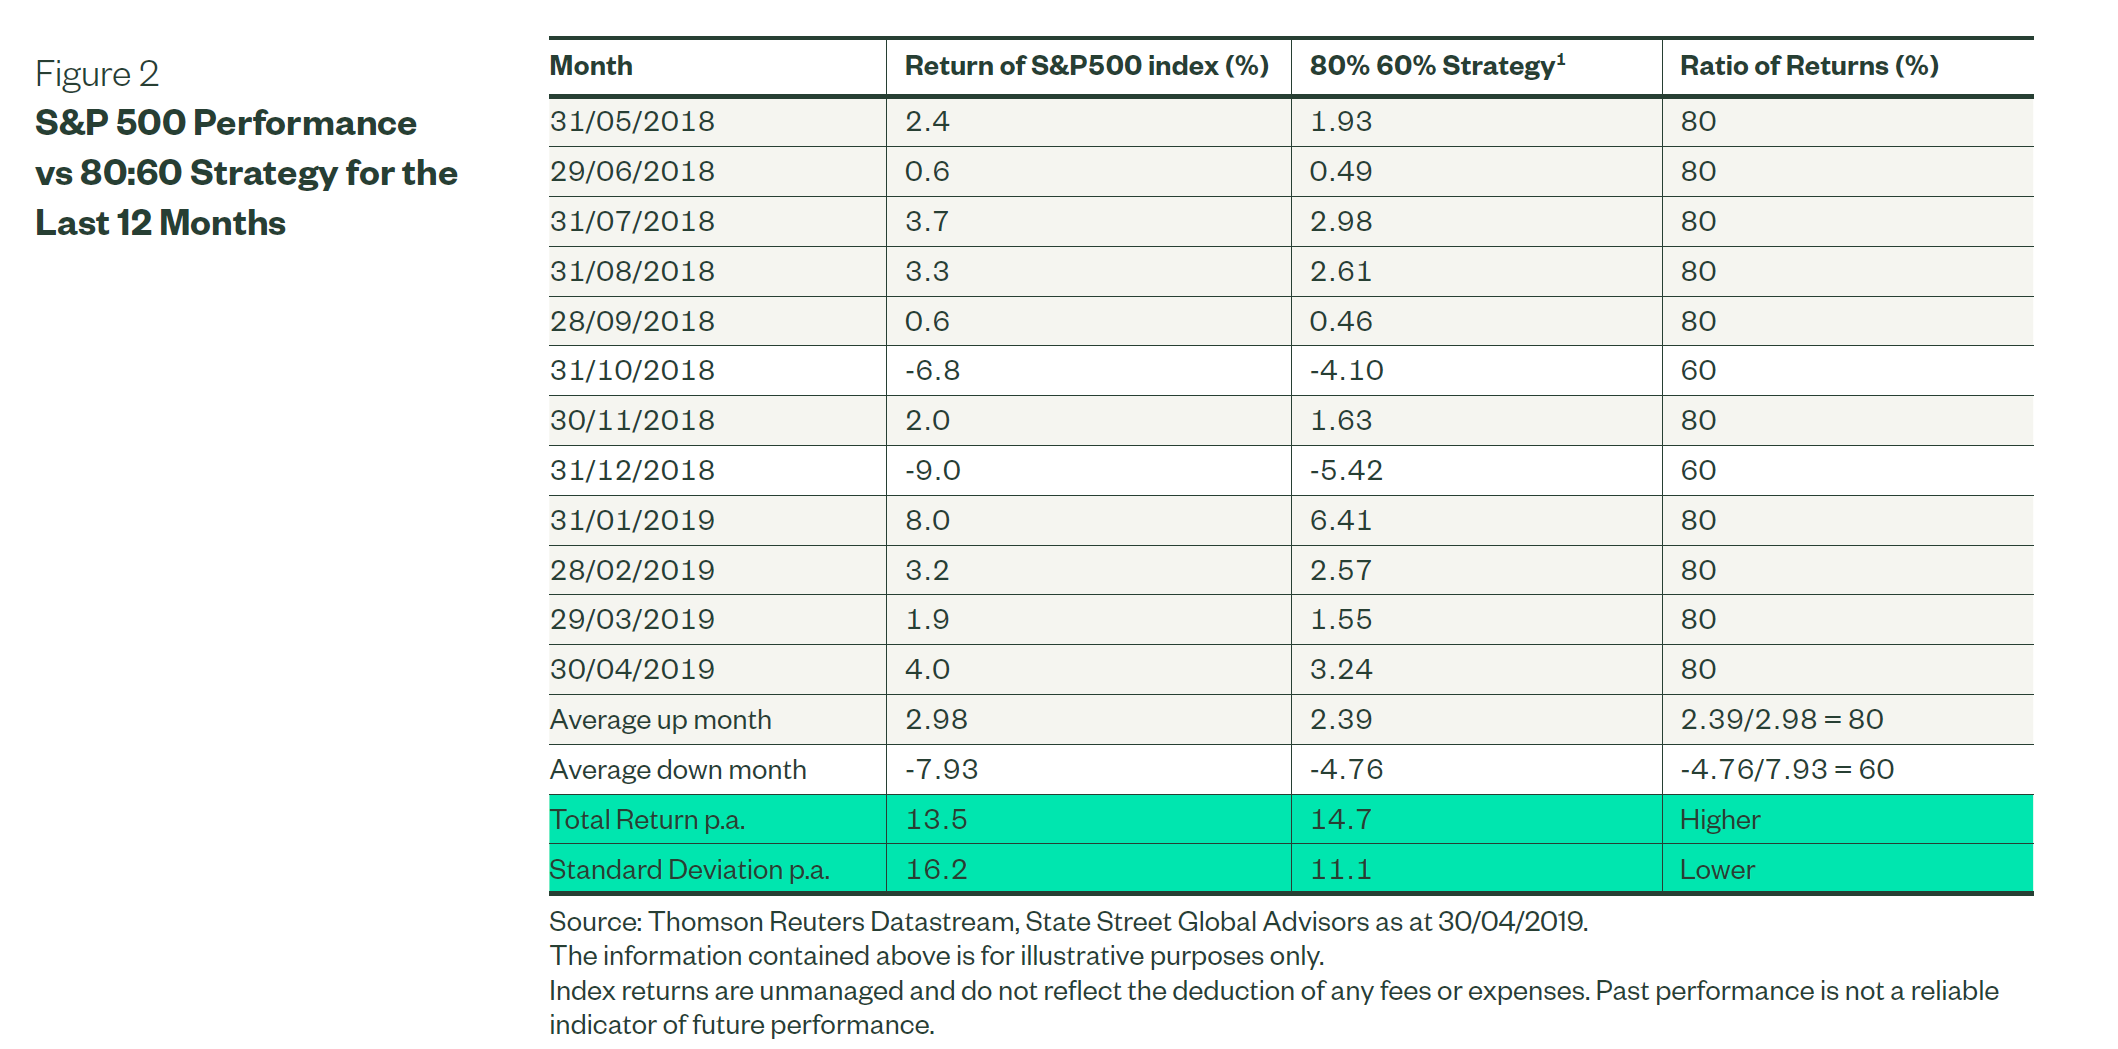
In Figure 2 below we provide a worked example of why upside downside capture measures are important. Consider the monthly returns from the S&P 500 index for the last 12 months to the end of April 2019. We then compare to a strategy that participates in 80% of the market rise and 60% of the market fall. The return and risk outcomes are significant.
In order to assess the longer term benefits of a strategy that can generate returns which on average capture 80% of an up month and only 60% of a down month we need a long history of returns. We’ve selected the Dow Jones index as our sample which goes back to 1900. The average characteristics of this distribution are contained in the table in Figure 3. Average upside and downside characteristics of the Dow Jones Index monthly Returns.
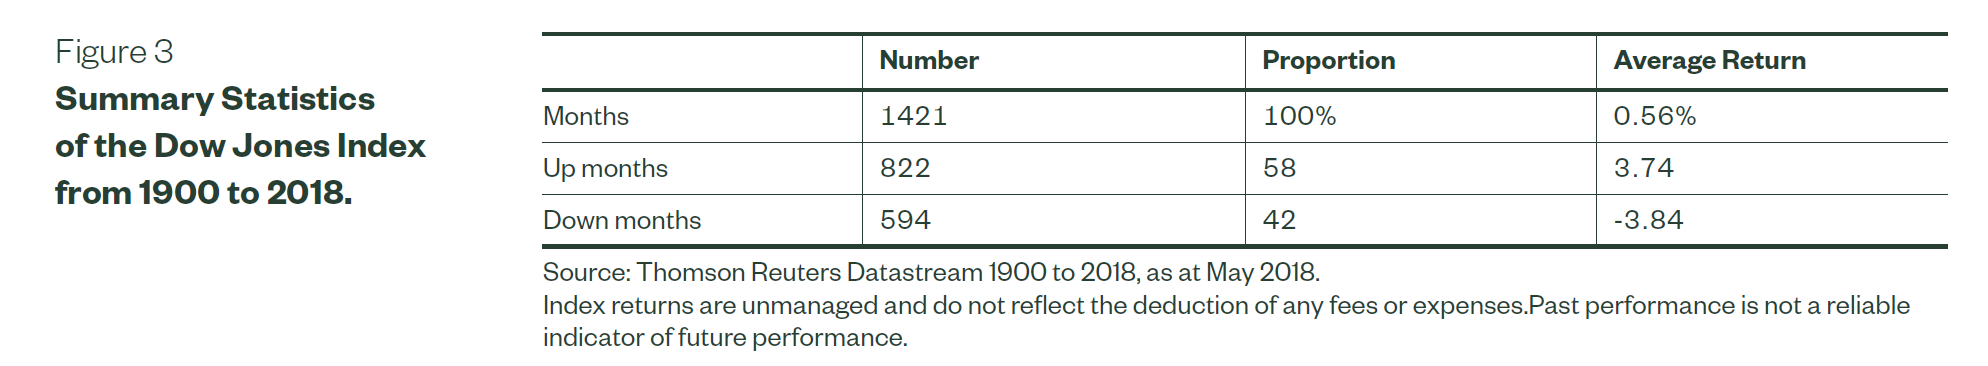
In this analysis of the Dow Jones Index there are 1421 monthly observations. Of those months, 58% of monthly returns were positive and 42% were negative. The average positive monthly return was +3.74% and the average negative monthly return was -3.84%. The power of the 80:60 is twofold: Firstly the proportion of negative months that a market or index may have and secondly in the asymmetry between average up and average down months
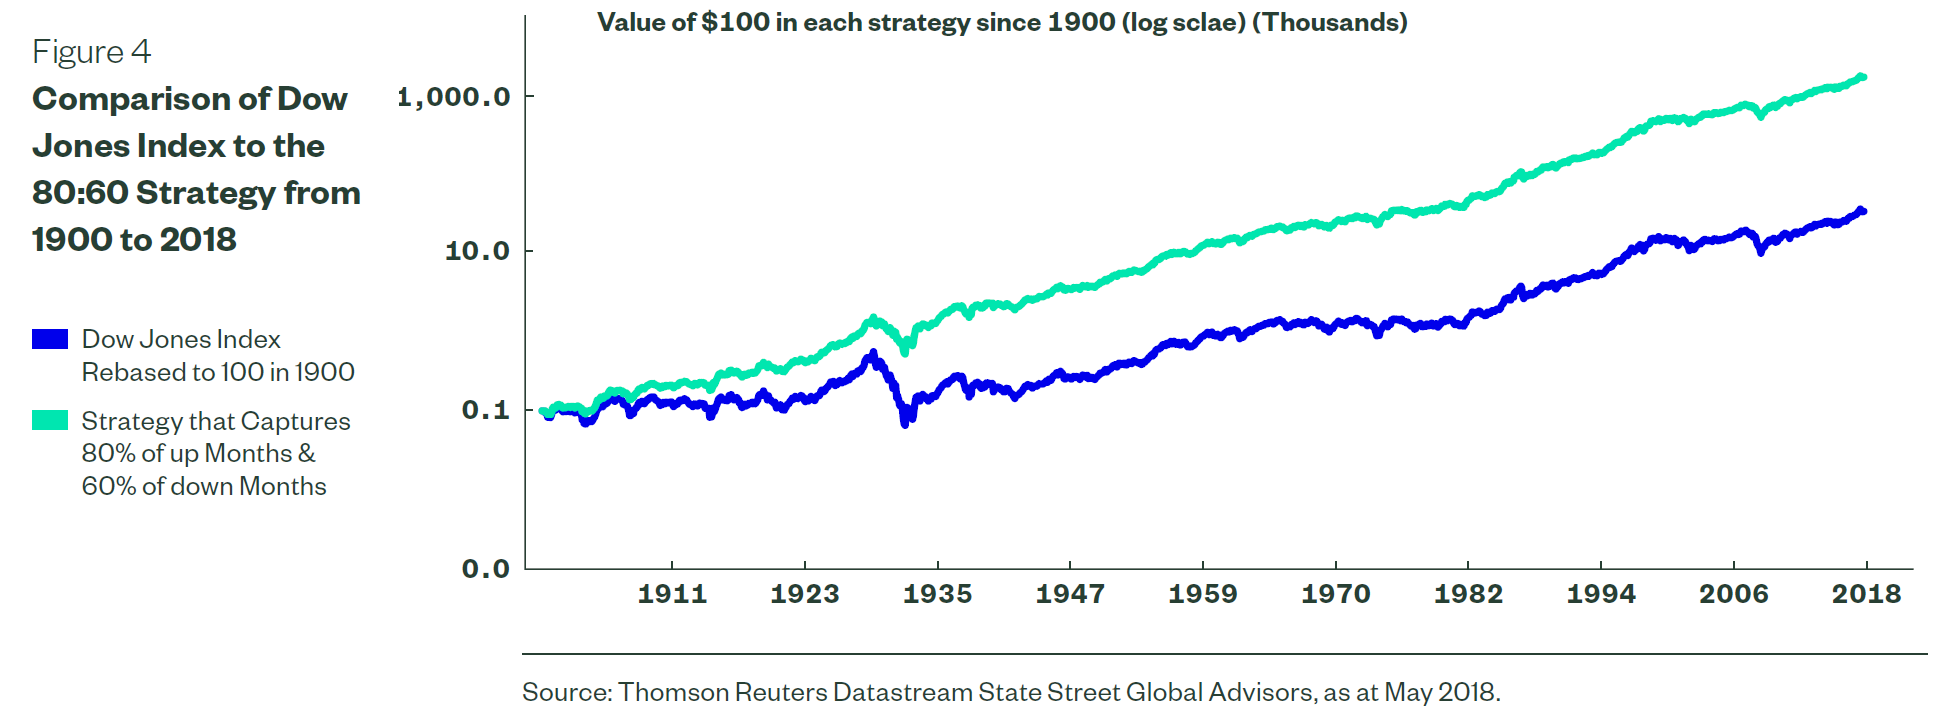
Applying the 80:60 Strategy to the full history of the Dow Jones index produces outperformance of 3.6% p.a. and annualised volatility is reduced from 18.1% to 12.8%, (-5.3% lower). Obviously both these characteristics are desirable
When we break this whole period down by decades we can observe the 80:60 Strategy tends to outperform in almost all decades. The only exception occurred in the 1950’s 1990’s. In both cases the difference was only minor. Both these decades were characterised by below average levels of volatility as can be seen from Figure 5 and Figure 6.
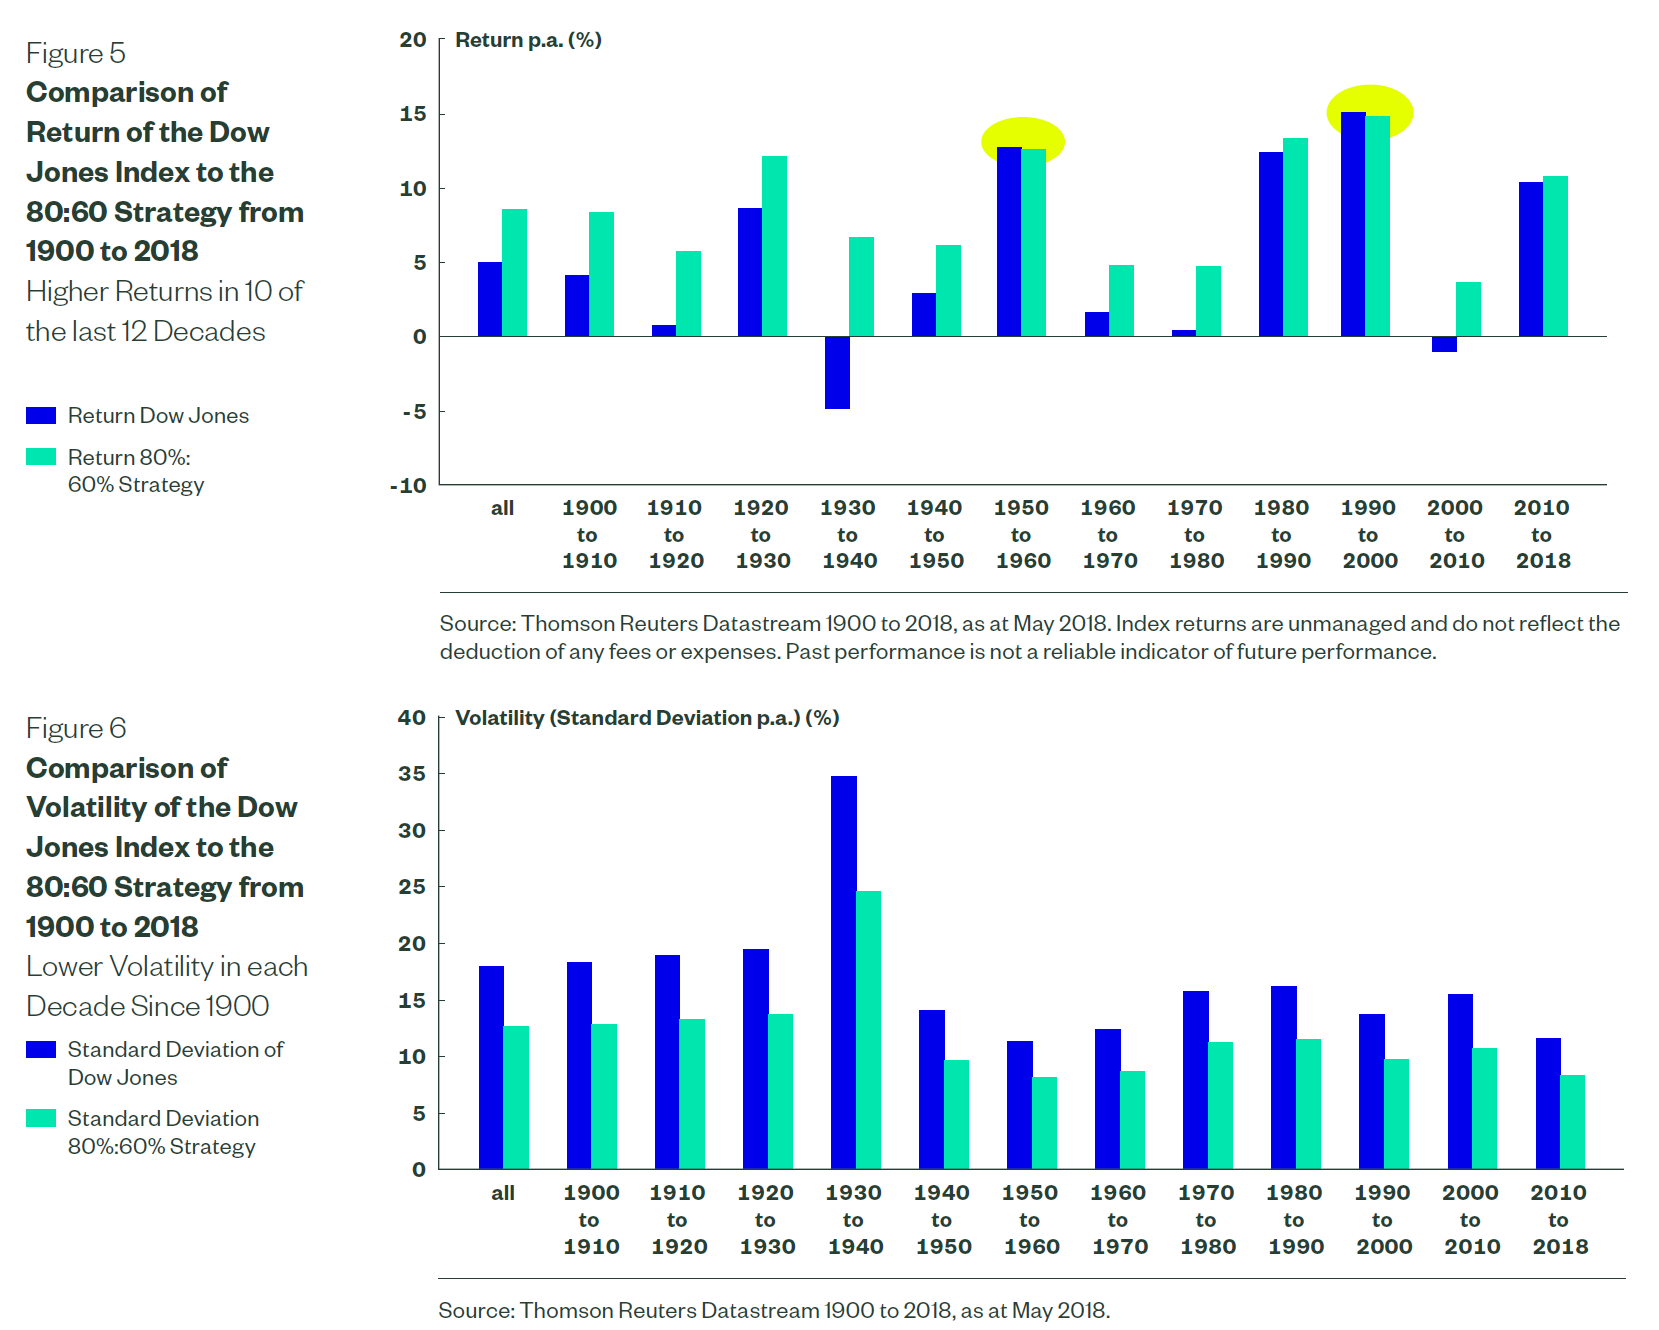
As you would expect the volatility of an 80:60 approach is also consistently lower across all decades. Importantly the peak to trough drawdowns are lower and the strategy is able to outperform in most periods of higher volatility by not losing as much and retaining a high base from which to capture positive returns. This aspect is especially relevant for those in retirement taking a monthly withdrawal from their savings.
Risk Aware Strategies are Relevant in Retirement
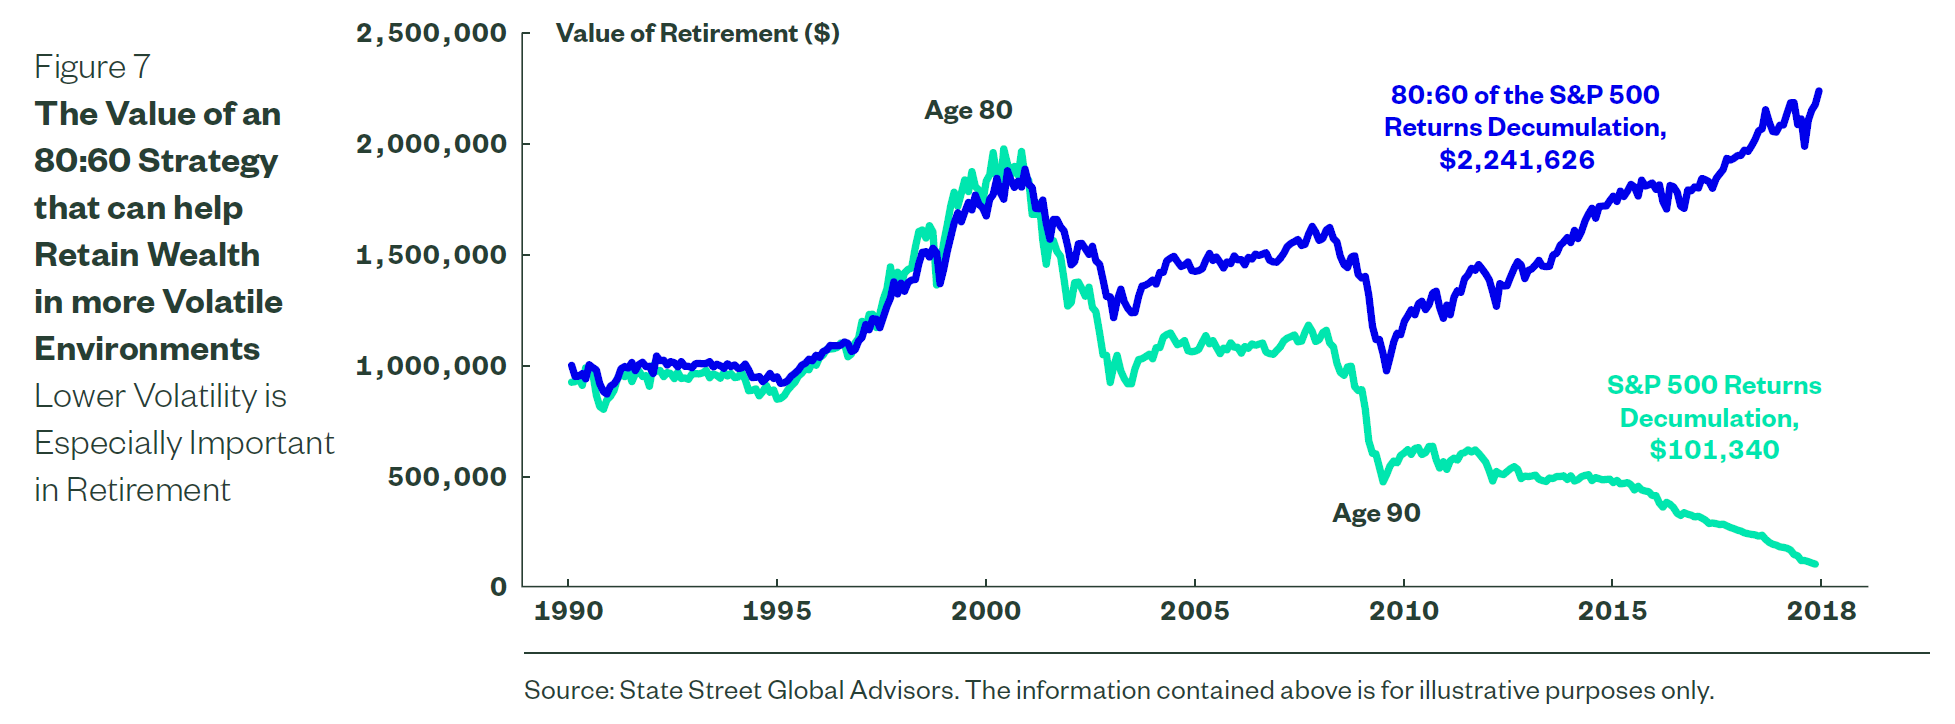
Strategies that can cushion on the downside can help investors retain their wealth to continue to generate positive returns. Large losses are difficult for retirees to recover from when they have no income to rebuild their capital base. A strategy such as the 80:60 can deliver lower volatility and can be especially valuable for those in de-accumulation phase. As the simple example illustrates both scenarios start with $1,000,000 at the age of 70 in 1990. Both withdraw $9,000 per month. After 30 years and two significant market corrections ( in 2000 and then again in the 2008) the 80:60 Strategy helps protect wealth and allowing the retiree to keep growing assets while the S&P 500 scenario erodes their wealth. It highlights that retirees who are drawing down in a falling market can benefit significantly from this strategy.
The 80:60 Strategy in Different Market Environments
Not all equity market environments are suited to the 80:60 Strategy. How consistent is the 80:60 Strategy and when should we expect a strategy with these characteristics to perform better or worse? In Figure 6 we drill down into each decade since 1900. Not surprisingly the most volatile decades coincided with the greatest outperformance. Indeed the decades that had the greatest proportion of down months also coincided with the 80:60 strategy greatest outperformance. Conversely the decades with the lowest volatility and lowest proportion of down months are the decades when the 80:60 Strategy is the least effective in delivering excess returns.
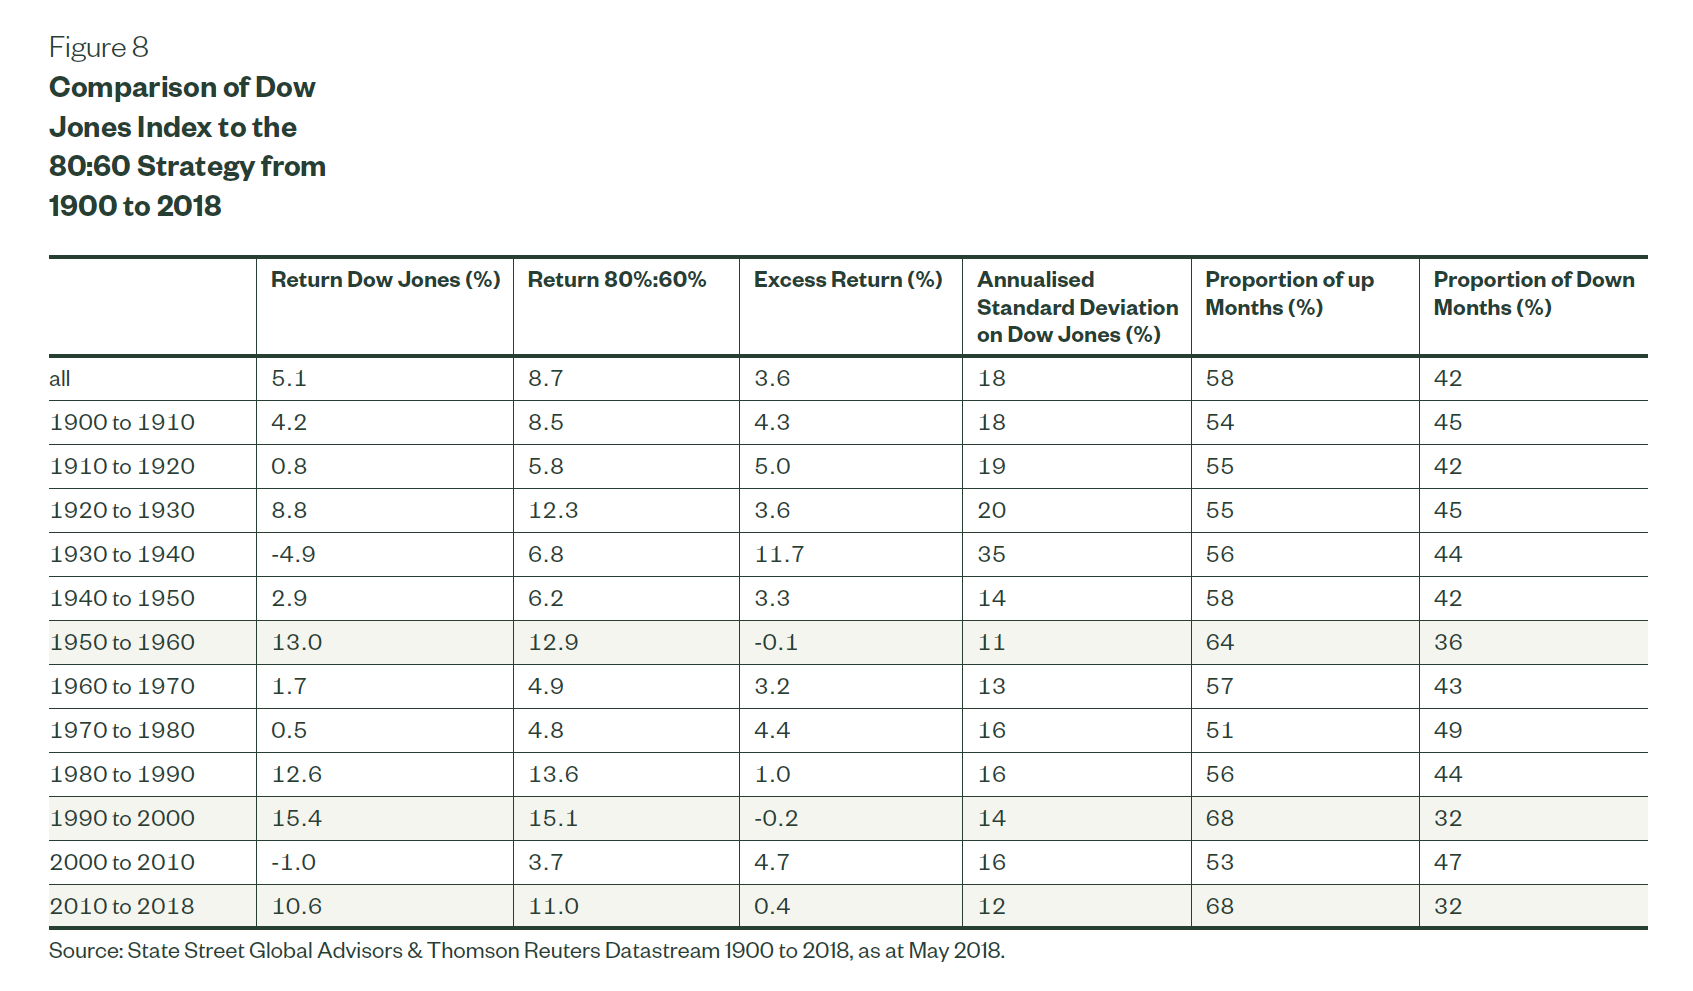
It is noteworthy that the current decade since 2010 has been the second least volatile decade since 1900. You have to go back to the 1950’s to find annualised volatility below 12% p. a. Central bank policy has been a significant contributing factor providing liquidity and shaping the low volatility high return environment over the last decade. As central banks withdraw stimulus what will market volatility look like in the coming 10 years?
When constructing portfolios to maximise long term outcomes, managing downside participation should be front of mind for both accumulators and retirees. Understanding an investment manager’s style can provide insights into the expected participation rates. So ask your managers what their upside/downside capture ratios are, review the skew in their returns and historical performance in volatile periods. These should all be key indicators of their future performance. In our view a strategy that focuses on value, quality, sentiment and lower volatility would be expected to provide lower downside participation, more consistent returns and a smoother investment journey for clients.
This article was produced with reference to the whitepaper produced by Bruce Apted of State Street Global Advisors.
If you would like to know more, talk to Michael Sik at FinPeak Advisers on 0404 446 766 or 02 8003 6865.
Important information and disclaimer
The information provided in this document is general information only and does not constitute personal advice. It has been prepared without taking into account any of your individual objectives, financial solutions or needs. Before acting on this information you should consider its appropriateness, having regard to your own objectives, financial situation and needs. You should read the relevant Product Disclosure Statements and seek personal advice from a qualified financial adviser. From time to time we may send you informative updates and details of the range of services we can provide. If you no longer want to receive this information please contact our office to opt out.
FinPeak Advisers ABN 20 412 206 738 is a Corporate Authorised Representative No. 1249766 of Aura Wealth Pty Ltd ABN 34 122 486 935 AFSL No. 458254
No Comments