
26 Mar Monthly Market Commentary – March 2021
Interest rates – a less orderly increase!
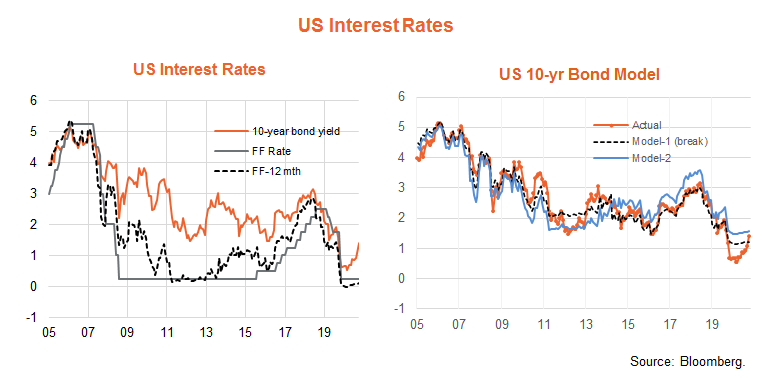
After gradually increasing over recent months, long-term bond yields rose more sharply in February, with the U.S. 10-year rate rising 34 basis points (bp) to 1.41%. Australian 10-year bond yields rose a staggering 78bp to 1.92%, with the 10-year spread widening from 6bp to 51bp.
Rising yields saw the Bloomberg Global Aggregate Bond Index (A$ hedged) decline by 1.6% in February, to be down 2.1% from its recent month-end peak at end-November. The Bloomberg AusBond Composite Index declined 3.6% in February, to be down 4.4% from its recent month-end peak at end-October 2020.
As evident in the charts below, there has been no material change in market expectations for the U.S. Fed funds rate in the next 12 months. Rather we’ve seen a steepening in the yield curve as longer-term policy tightening and inflation fears intensified. Based on our modelling, U.S. 10-year bond yields are now in their fair-value range based on the current Fed funds rate and market expectations for no lift in that rate for the next 12-months.
Local one-year ahead policy expectations have not changed either. As can be seen in the chart below, Australian 10-year bond yields have pushed above their fair-value range of around 1.3%, which in turn reflects a widening in the spread to U.S. 10-year yields above fair value estimated at around 10bp.
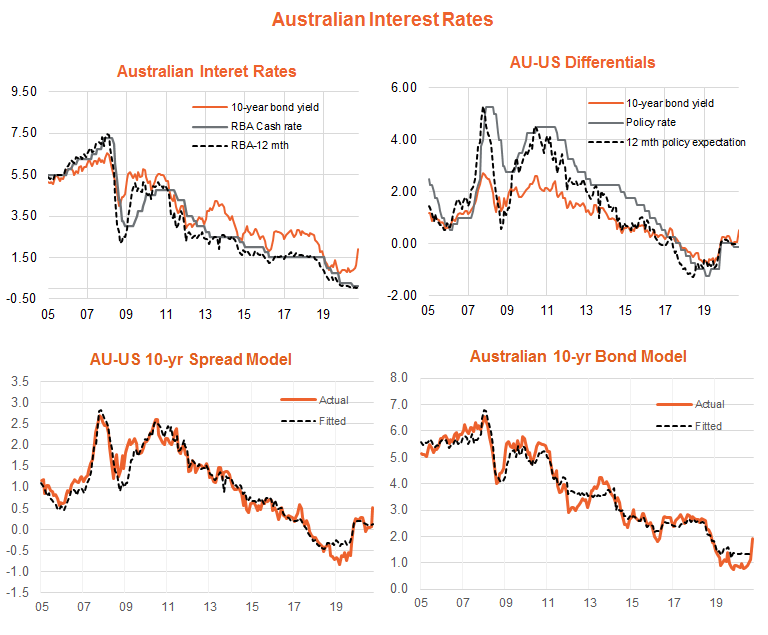
With inflation expected to remain stubbornly low, my base case expectation has been for Australian (and U.S.) policy rates to remain on hold this year, and the market to end the year still expecting no policy tightening in 2022. Modelling suggests that should be consistent with both U.S. and Australian 10-year bond yields ending the year close to current levels of around 1.25% to 1.5%.
That said there is a risk of a short-term lift in core annual U.S. inflation above 2% which could cause a sharper near-term upward move in yields. Provided inflation pushes back below 2% by year-end, this should contain yields thereafter. A relatively contained yield outlook suggests fixed-rate bonds should produce positive returns over the remainder of the year (especially given current elevated yields), likely in excess of cash.
Australian dollar – firm for now but should ease
The global ‘reflation/re-opening’ trade continues to support the Australian dollar. Helped by a further lift in iron-ore prices to US$165/tonne, the Australian dollar rose 0.8% in February to reach US$0.7706 . The other two key drivers of the Australian dollar – the US$ and relative short-term interest rate differentials – were relatively steady over the month. The Australian dollar briefly touched US80c towards the end of the month, which is still a touch below our model estimate of current fair-value around US81c.
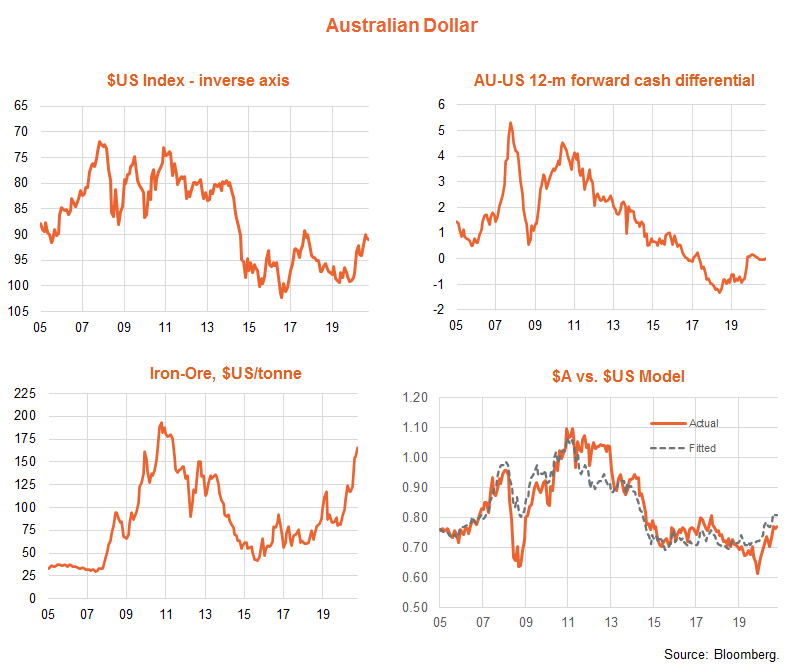
My year-end Australian dollar target remains lower at around US74c, based on an expected 5% strengthening in the US$ and a decline in iron-ore prices. Expected US$ appreciation is based on a relatively strong U.S. economic growth outlook (underpinned by major further fiscal stimulus) and a reassertion of the outperformance of U.S. favoured technology/growth sectors globally as the year progresses. I also continue to anticipate a pull back in iron-ore prices as China eases back on policy stimulus and Brazilian supply further recovers.
Equity prices – earnings-driven recovery
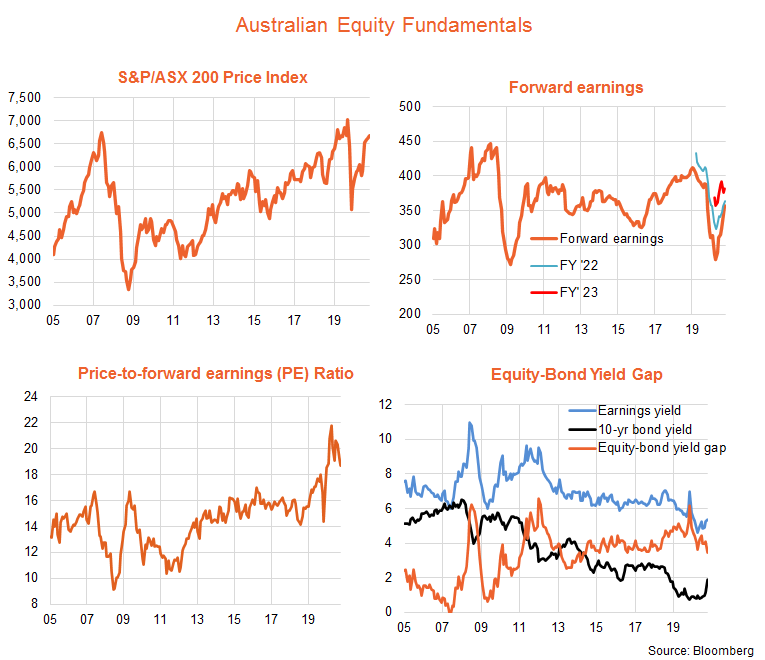
The S&P/ASX 200 Index rose 1.0% in February, which was a bit less than the solid 3.7% growth in forward earnings. As a result, the price-to-forward earnings ratio (PE) dipped from 19.1 to 18.7, compared to a recent month-end peak of 21.8 at end-August. The rise in 10-year bond yields, however, meant the forward earnings-to-bond yield gap (EBYG) narrowed from 4.1% to 3.4% – compared to an average since 2011 of around 4%. Overall, PE valuations still don’t appear overly stretched given the still relatively low level of bond yields.
Looking forward, if 10-year yields narrowed back to 1.5% by year-end, and the EBYG widened back to 4%, it would imply a year-end PE ratio of 18.25, or 2.5% below current levels. While higher interest rates might place further downward pressure on PE valuations, however, there’s also scope for the EBYG to narrow given its longer-run average (at least since 2005) is 3.3%.
Meanwhile, the earnings outlook remains encouraging, albeit not quite as robust as evident in other markets such as the U.S. Current market expectations imply 5% growth in local forward earnings by year-end, compared to 12% for the US S&P 500 and the MSCI All-Country World Index. Encouragingly, earnings expectations also continue to be upgraded both locally and globally in line with upgrades to the economic outlook. I anticipate further upgrades, such that local forward earnings rise by 1o% by year-end – and global earnings close to 17% by year-end.
All up, this implies around a 7.5% further lift in the S&P/ASX 200 Index by year end, to a level around 7,250. Supported by stronger earnings, and a likely weaker Australian dollar, I anticipate stronger gains in unhedged global equities.
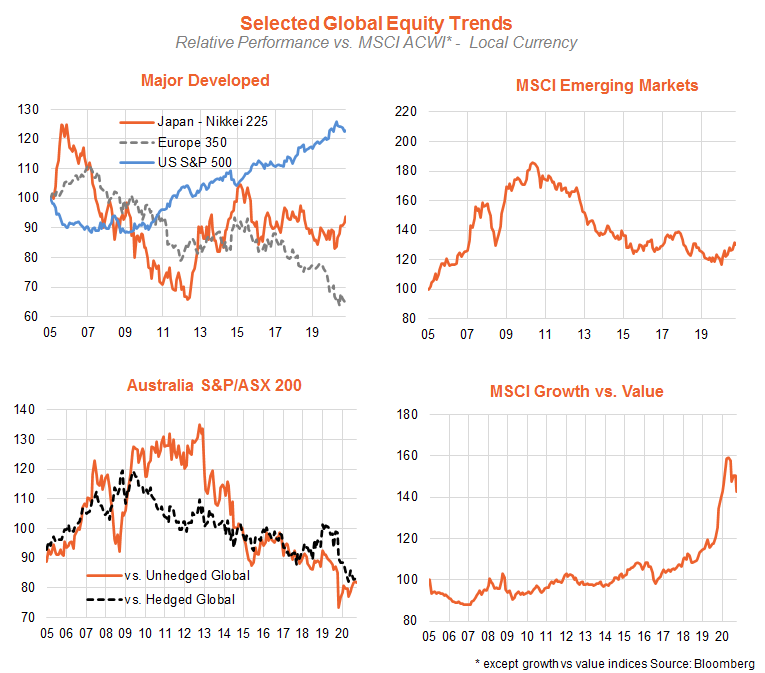
Equity trends – value showing strength
Among regions, Japan and Europe had relatively strong months, though Japan and emerging markets remains the top relative performers. Among sectors, ‘value’ sectors such as financials and energy did especially well – reflecting strength in interest rates and oil prices respectively. Growth sectors such as technology and consumer discretionary were more subdued. All up, this meant value outperformed growth in the month, though on the basis of longer-run (6-12 month) relative performance, the growth factor (along with small caps and quality) are still in the lead.
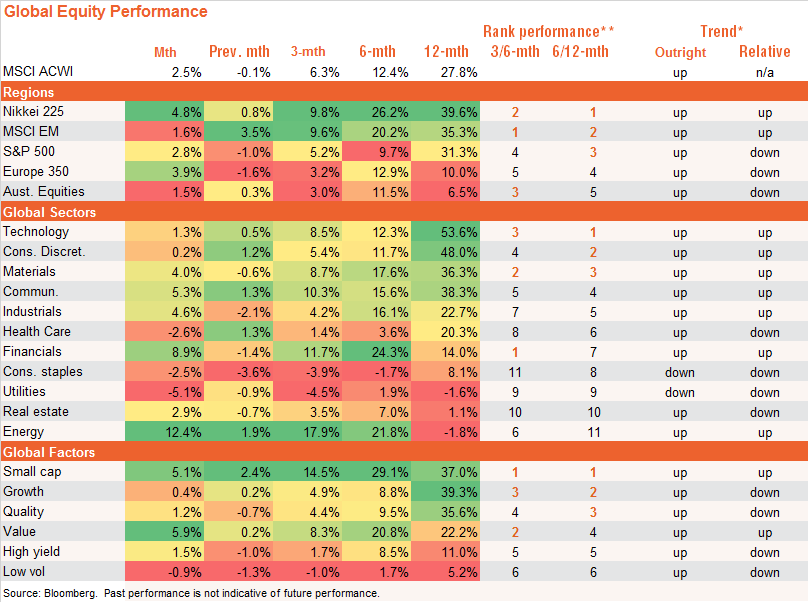
Tables ordered by 6/12 month return performance for each region, sector and factor respectively – on a local currency basis. Past performance is not indicative of future performance of any index or fund. You cannot invest directly in an index. Does not take into account any fund fees and costs.
This article was originally produced by David Bassanese from BetaShares you can read the full article here.
Next Steps
To find out more about how a financial adviser can help, speak to us to get you moving in the right direction.
Important information and disclaimer
The information provided in this document is general information only and does not constitute personal advice. It has been prepared without taking into account any of your individual objectives, financial solutions or needs. Before acting on this information you should consider its appropriateness, having regard to your own objectives, financial situation and needs. You should read the relevant Product Disclosure Statements and seek personal advice from a qualified financial adviser. From time to time we may send you informative updates and details of the range of services we can provide.
FinPeak Advisers ABN 20 412 206 738 is a Corporate Authorised Representative No. 1249766 of Aura Wealth Pty Ltd ABN 34 122 486 935 AFSL No. 458254 (a subsidiary of Spark FG ABN 15 621 553 786)
No Comments