
30 Nov Monthly Commentary: November 2023
Yielding to yields
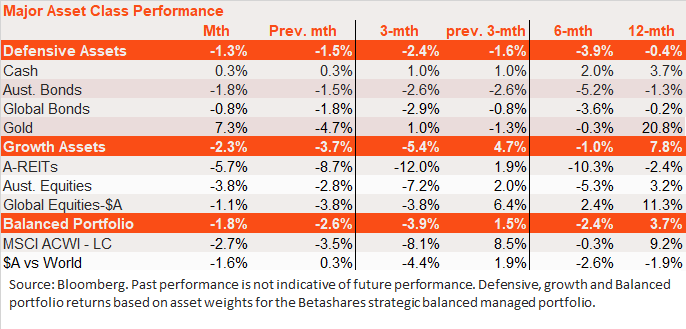
Both defensive and growth assets weakened further in October, reflecting another solid increase in global bond yields. The Hamas attack on Israel was a major development in the month, which initially led to a spike in oil prices and renewed global inflation concerns.
Growth assets declined more than defensive assets, with global (hedged equities) down 2.7% and Australian equities down 3.8%. The interest rate-sensitive listed property sector weakened by 5.7%.
Among defensive assets, bonds underperformed cash, reflecting the rise in bond yields. Despite higher bond yields and a strong US dollar, gold prices rose due to the rise in geopolitical concerns.
Cash returns
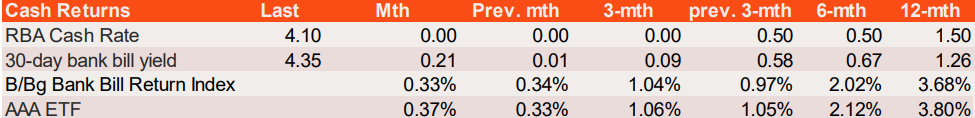
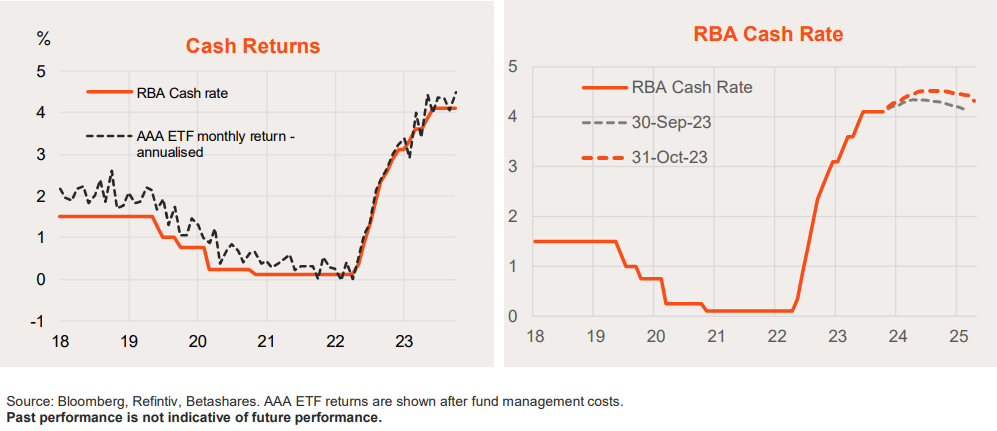
The RBA left the cash rate unchanged at 4.1% p.a. in October for the fifth month in a row.
That said, a higher-than-expected Q3 CPI result, along with steadily rising house prices, has heightened the risk that the RBA will raise interest rates at the November policy meeting.
Markets are pricing almost two rate rises by mid-2024 and steady rates in H2’24. My base case is for one further rate rise by year-end, than at least two rates cuts in H2’24. Reflecting the current 4.1% p.a. official cash rate, the Bloomberg Bank Bill Index returned 0.33% in October, or 4% annualised, as did the AAA cash ETF. AAA’s returns have broadly matched the RBA cash rate since early 2022.
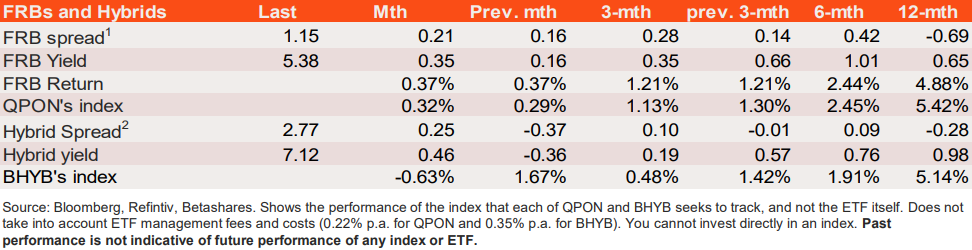
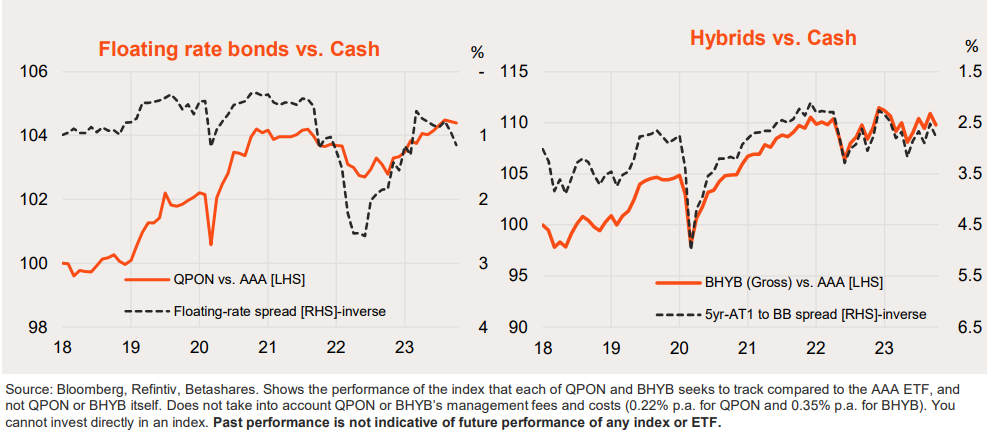
Floating rate bonds and hybrids
After having narrowed substantially since mid-2022 (following an earlier sharp widening), the floating rate spread has been modestly widening so far in 2023.
The spread over 30-day bank bills widened a little further (0.21%) in October to 1.15%, resulting in floating-rate bond returns similar to that of cash (despite a higher yield), with floating rate bonds returning 0.32% (based on QPON’s index performance). Spread compression and a higher starting yield allowed floating rate bonds to return 5.4% over the past year, compared to 3.8% for AAA.
The FRB spread is now a little wider than its average in the two years prior to 2020’s Covid crisis.
The hybrid spread over bank bills has been in a choppy sideways range since around mid-2022. It widened a little in October to 2.77%, to be around its average since mid2022. Spread widening saw major bank hybrid returns decline by 0.63% over October (based on BHYB’s index performance) after a 1.7% gain in September.
The hybrid spread remains somewhat tighter than the average of around 3.5% in the two years prior to the 2020 Covid crisis.
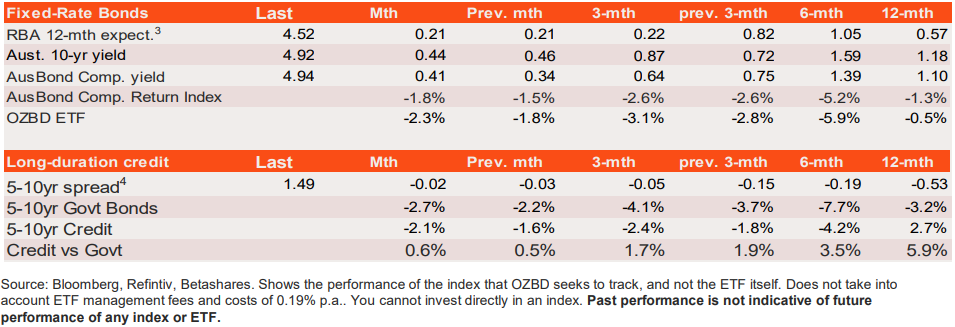
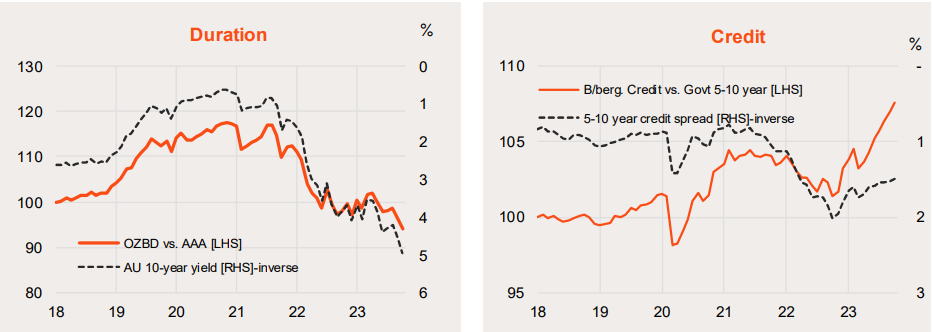
Fixed-rate Australian bonds
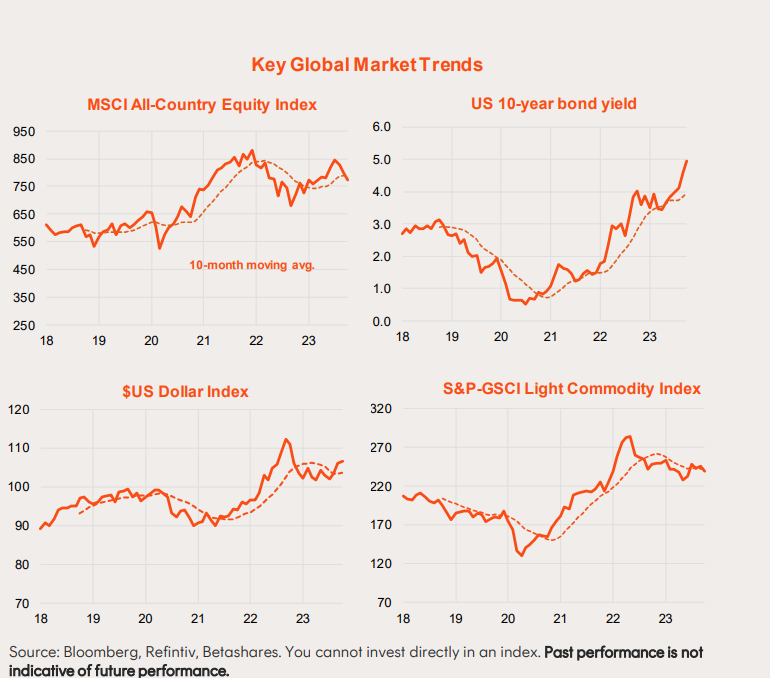
Australian long-term bond yields rose further in October, reflecting the rise in global yields and heightened local monetary policy tightening expectations following the higher-than-expected Q3 CPI.
Australian 10-year bond yields rose 0.44% to 4.92% while the yield on the Bloomberg AusBond Composite Index rose 0.41% to 4.94%. As a result, the AusBond Composite Index fell by 1.8% in the month, while OZBD’s index declined by 2.3%.
Bonds have underperformed cash with the rebound in bond yields since earlier this year – as markets have moved from fearing a global recession to ‘higher for longer’ interest rates due to economic resilience.
Note fixed-rate bond returns have nonetheless been positive over the past year – albeit less positive than cash. OZBD’s index also produced stronger returns than the AusBond Composite.
Note also despite the sell-off in bonds this year, credit spreads on longer-duration bonds have continued to narrow (likely reflecting reduced recession fears) – resulting in long-duration credit outperforming long-duration government bonds.
Source: Bloomberg, Refintiv, Betashares. Shows the performance of the index that OZBD seeks to track compared to the AAA ETF, and not the ETF itself. Does not take into account ETF management fees and costs of 0.19% p.a.. You cannot invest directly in an index. Past performance is not indicative of future performance of any index or ETF.
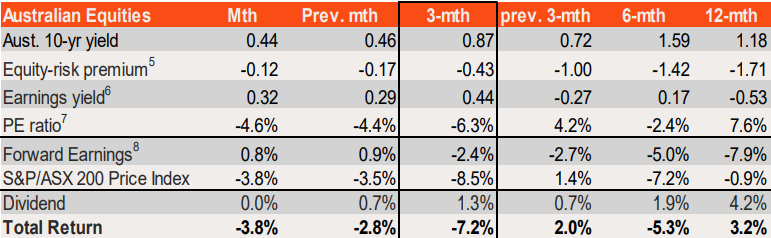
Australian equities
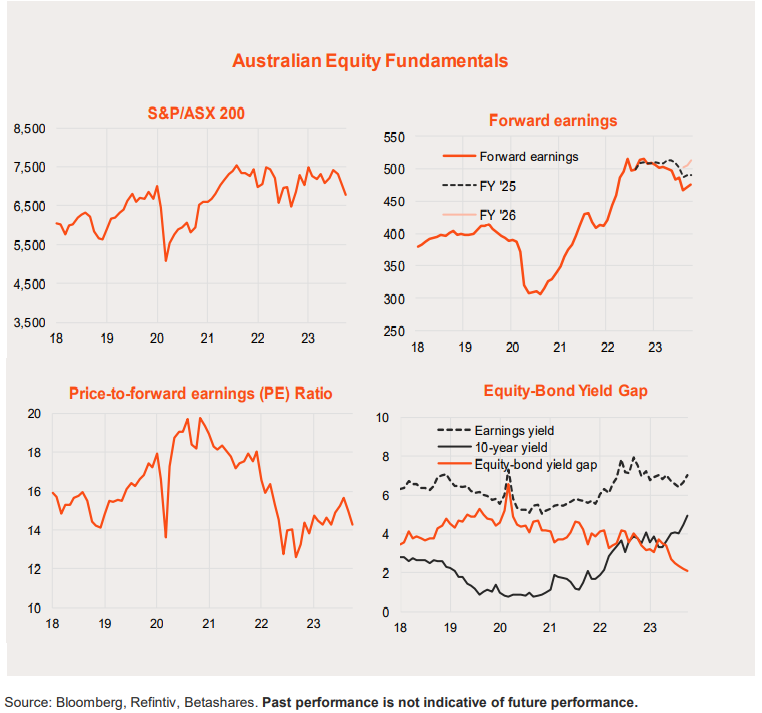
The S&P/ASX 200 Price Index dropped 3.8% in October, after a 3.5% decline in September. This reflected a further drop in the PE ratio (from 15.0 to 14.3) in the face of sharply rising bond yields, partly offset by a 0.8% rise in forward earnings.
Given the rise in bond yields, the decline in the PE ratio and equity prices would have been greater were it not for a further 0.12% narrowing in the already relatively low equity risk premium to 2.1%.
With flat reported dividends, total returns from the market were also down -3.8% in October.
After recovering from the 2022 sell-off earlier this year, the market has since moved in a choppy sideways range in recent months. This has been due to generally falling earnings, partly offset by a rising PE ratio. One bright spot is that earnings expectations have stabilised in recent months, which has allowed for a modest recovery in forward earnings.
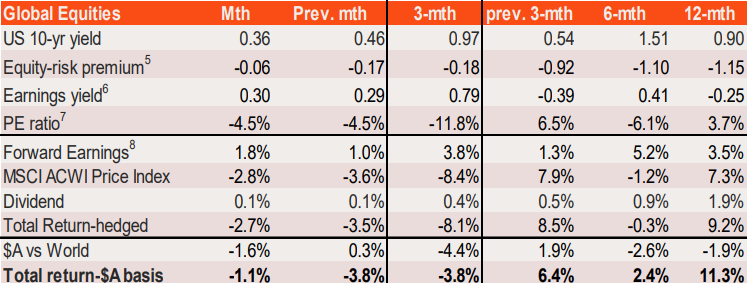
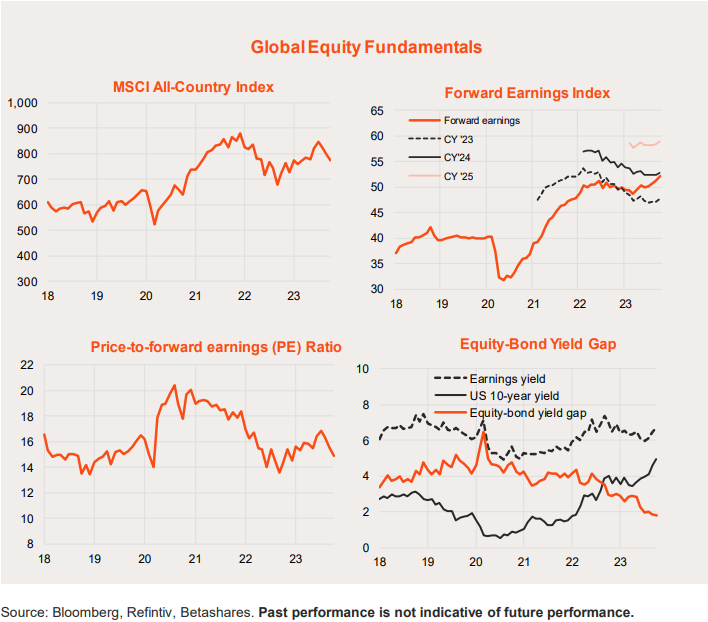
Global equities
The MSCI All-Country World Index also declined in October, with (as in Australia) pressure on PE valuations due to higher bond yields only partly offset by a continued recovery in
forward earnings.
Global equities have outperformed Australian equities over the past year largely because of a stronger uplift in forward earnings (+3.5% vs -7.9% earnings decline in Australia).
The global market’s PE valuation is broadly in line with its long-run average and earnings are recovering. As in Australia, the main challenge now is that high bond yields have left the market’s equity-risk premium relatively narrow by the standards of the past 10-20 years.
This article was originally produced by David Bassanese from BetaShares. You can read the full article here.
Next Steps
To find out more about how a financial adviser can help, speak to us to get you moving in the right direction.
Important information and disclaimer
The information provided in this document is general information only and does not constitute personal advice. It has been prepared without taking into account any of your individual objectives, financial solutions or needs. Before acting on this information you should consider its appropriateness, having regard to your own objectives, financial situation and needs. You should read the relevant Product Disclosure Statements and seek personal advice from a qualified financial adviser. From time to time we may send you informative updates and details of the range of services we can provide.
FinPeak Advisers ABN 20 412 206 738 is a Corporate Authorised Representative No. 1249766 of Spark Advisers Australia Pty Ltd ABN 34 122 486 935 AFSL No. 458254 (a subsidiary of Spark FG ABN 15 621 553 786)
No Comments