
05 Oct Australian Home Prices Have Taken 15 Years to Double, What does this mean?
There’s a common perception that property prices double every seven to ten years. Despite the strong price growth through the pandemic, this hasn’t been the case lately.
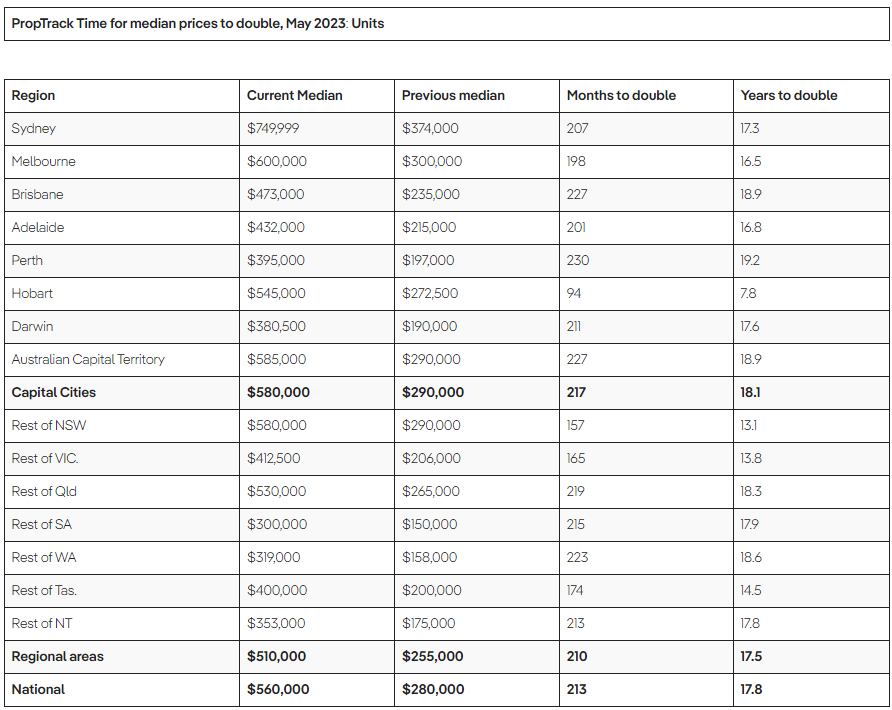
In May 2023, the median house price nationally was $730,000 and the median unit price was $560,000. Median house prices had taken 15.4 years (185 months) to double while median unit prices had taken 17.8 years (213 months) to double in price.
Median house prices across the capital cities doubled quicker (14.3 years) than they did across regional markets (16 years). For units it was a different story with regional prices doubling quicker (17.5 years) than those in capital cities (18.1 years).
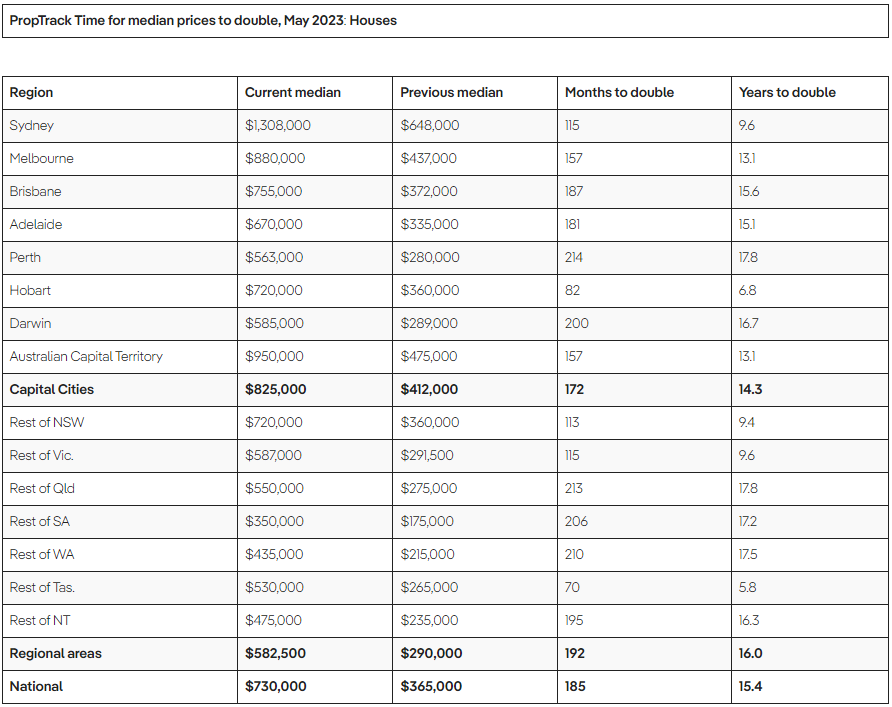
The only markets in which median house prices doubled in less than a decade were regional Tasmania (5.8 years), Hobart (6.8 years), regional NSW (9.4 years), regional Victoria (9.6 years) and Sydney (9.6 years).
Median house prices have taken longest to double in Perth (17.8 years), regional Queensland (17.8 years) and regional WA (17.5 years).
Unit prices taking longer to double than houses
Hobart was the only market in which unit prices doubled in less than a decade, taking 7.8 years, while prices doubled relatively quickly in regional NSW (13.1 years) and regional Vic (13.8 years).
Median unit prices have taken longest to double in Perth (19.2 years), Brisbane (18.9 years) and Canberra (18.9 years).
Breaking down this data and converting it to an annualised growth rate we observe the following:
For Houses:
- The top five areas were Rest of Tas at 12.25% pa, Hobart at 10.75%pa, Rest of NSW at 7.72%pa, Sydney at 7.47%pa, Rest of Vic at 7.47%pa.
- The bottom five areas were Perth at 4.09%pa, Rest of QLD at 4.09%pa, Rest of WA at 4.13%pa, Rest of SA at 4.18%, Darwin at 4.36%pa.
For Units:
- The top five areas were Hobart at 9.34%pa, Rest of Tas at 8.89%pa, Rest of VIC at 4.61%pa, Rest of NSW at 4.45%pa, Rest of NT at 4.42%pa.
- The bottom five areas were Perth at 3.81%pa, Brisbane at 3.86%pa, ACT at 3.86%pa, Rest of WA at 3.97%, Sydney at 4.17%pa.
It’s also interesting to note that median house prices in some of the more expensive cities such as Sydney, Melbourne and Canberra have doubled more quickly than those in cities with cheaper median prices such as Brisbane, Adelaide, Perth and Darwin.
Across every capital city and regional area, median house prices have doubled over a shorter period of time than median unit prices have. This highlights that houses tend to appreciate in price quicker than units.
The lower price point and slower growth also highlights that housing more of Australia in units is a good way to address our housing affordability challenges.
Will the pace of price growth pick up?
Prices have generally taken longer than a decade to double in price, despite very strong price rises across most of the country through the pandemic and that is a trend we expect to continue over the coming years.
The key drivers of strong price growth over recent decades were primarily falling interest rates which increase borrowing capacity, increasing household incomes as more women joined the workforce, easier and greater access to finance, and migration creating strong demand for housing.
While there is little sign of strong migration of the past decade abating, interest rates are unlikely to fall like they have over recent decades, employment participation is unlikely to increase as much and accessing a mortgage is more difficult than it has been in the past.
It looks like the days of property prices doubling every seven to ten years may be well and truly in the past. As an investor, you not only need to consider the future prospects of this particular asset class given the apparent headwinds of likely higher for longer interest rates but also the opportunity costs and your personal circumstances. As always, you should consult a financial adviser to determine the course of action most appropriate for your situation as they can help you navigate this in a personal context.
This article was originally produced by Cameron Kusher from PropTrack. You can read the full article here.
Next Steps
To find out more about how a financial adviser can help, speak to us to get you moving in the right direction.
Important information and disclaimer
The information provided in this document is general information only and does not constitute personal advice. It has been prepared without taking into account any of your individual objectives, financial solutions or needs. Before acting on this information you should consider its appropriateness, having regard to your own objectives, financial situation and needs. You should read the relevant Product Disclosure Statements and seek personal advice from a qualified financial adviser. From time to time we may send you informative updates and details of the range of services we can provide.
FinPeak Advisers ABN 20 412 206 738 is a Corporate Authorised Representative No. 1249766 of Spark Advisers Australia Pty Ltd ABN 34 122 486 935 AFSL No. 458254 (a subsidiary of Spark FG ABN 15 621 553 786)
No Comments