
Key global trends - equity rally continues
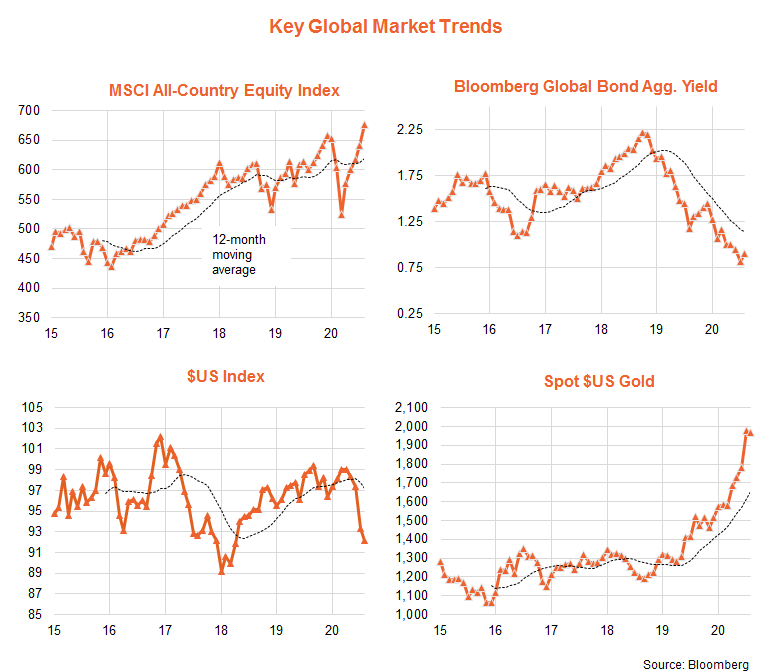
Global equities continued their V-shaped recovery in August, while the $US continued its decline. In a counter-trend move, perhaps reflecting growing investor confidence in an economic recovery, there was a small uptick in global bond yields and an easing back in gold prices. Watch on YouTube — Watch on YouTube
 As seen in the chart set below, global bond yields and the $US remain in a downtrend, and gold prices in an uptrend*. On a total return basis, global equities have surpassed their previous peak at the end of last year, to be at the top end of a very wide and volatile range since early 2018.
Global equity fundamentals – bond yields still low, earnings expectations have lifted
The MSCI All-World Equity Index returned 5.8% in local currency terms in August. The lift in returns over recent months has largely been driven by a rise in price-to-forward earnings (PE) valuations, which reached a well-above-average 19.9 as at end-August, compared to 19.3 as at the end of September. Rising PE valuations in turn have been supported by very low bond yields and investors’ hopes that economic and earnings weakness will be fairly short-lived.
In this regard, the yield on the Bloomberg Global Aggregate Bond Index lifted modestly to 0.9% (from 0.81%) in August, implying that the equity forward earnings-to-bond yield gap edged a bit lower to 4.1% in the month. While this yield gap is modestly below its post-GFC average of 5.2%, it is still close to its 20-year average of 4.2% and comfortably above its 30-year average of 2.6%. All this suggests a deal of uncertainty as to the fair value of equities, especially if bond yields stay close to current lows.
What’s more, an encouraging (and surprising!) development in recent months has been a modest upgrade to previously beaten down earnings expectations – such that forward earnings have also moved higher since bottoming in May.
Indeed, global forward earnings rose 6% in the three months to end-August, underpinned by a 10% gain in the U.S. market. Australian forward earnings, by contrast, declined by 10% over this period.
As surveyed by Bloomberg, analysts on average currently expect global earnings to decline by 23% this year, before rebounding by 29% in 2021 – leaving earnings only slightly below 2019 levels. While that still appears overly optimistic, if expectations hold it would imply a further 8% gain in global forward earnings by year end and a 16% gain over 2021.

Key global equity trends – U.S., technology, growth and quality
As seen in the table below, among the key regions, the U.S. market continued to power ahead in August, while emerging markets corrected after recent strong gains and Japan’s market bounced back. Among global sectors, the usual suspects of technology, consumer discretionary and communications continued to dominate, though industrials also delivered relatively strong gains last month. Growth, momentum and quality remain the leading global factor exposures.
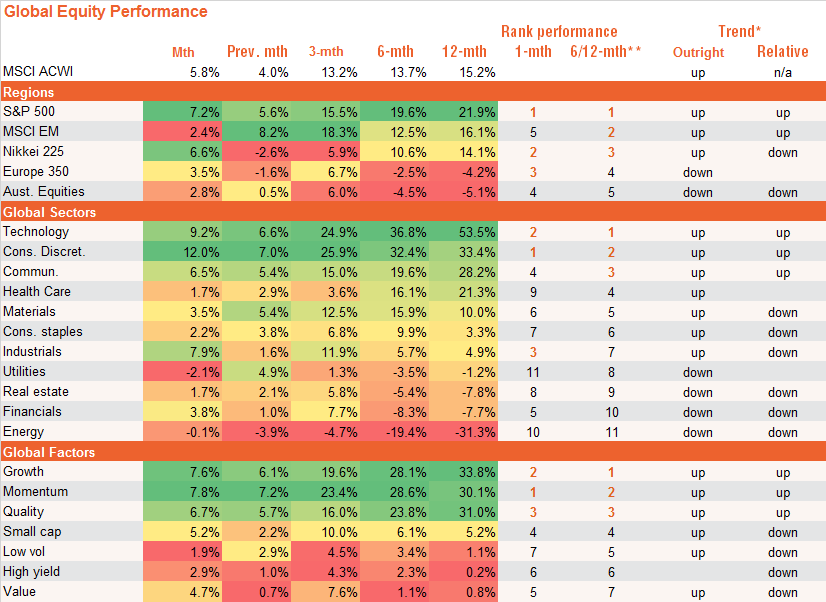
Source: Bloomberg. Tables ordered by 6/12 month return performance for each region, sector and factor respectively. Past performance is not indicative of future performance. You cannot invest directly in an index.
Cash and bonds – government yields drop, credit spreads widen
In the local cash and fixed income market, overall bond yields rose slightly, causing the fixed income bond benchmark to underperform cash for the first time in several months – though the trend of falling yields has clearly favoured the former for some time. Despite a slight widening in the longer-term (5-10 year) credit spread, long duration credit continued to outperform long duration government bonds, due to the former’s higher yield.

*Trend: Outright trend is up if the relevant NAV return index is above its 12-month moving average and the slope of the moving average is positive, and down if the index is below this moving average and the slope of the moving average is negative. No trend is displayed in all other cases. Relative trend is based on the ratio of the relevant return index to its broader Australian or global benchmark index.
**The ranking of performance is based on an equally-weighted average of 6 & 12 month return performance.
This article was produced by David Bassanese from Betashares, click here to view the full article.
Next Steps
To find out more about this program and whether you might be eligible, speak to us to get you moving in the right direction.
Important information and disclaimer
The information provided in this document is general information only and does not constitute personal advice. It has been prepared without taking into account any of your individual objectives, financial solutions or needs. Before acting on this information you should consider its appropriateness, having regard to your own objectives, financial situation and needs. You should read the relevant Product Disclosure Statements and seek personal advice from a qualified financial adviser. From time to time we may send you informative updates and details of the range of services we can provide.
FinPeak Advisers ABN 20 412 206 738 is a Corporate Authorised Representative No. 1249766 of Aura Wealth Pty Ltd ABN 34 122 486 935 AFSL No. 458254 (a subsidiary of Spark FG ABN 15 621 553 786)