
Key global trends - equity rally continues
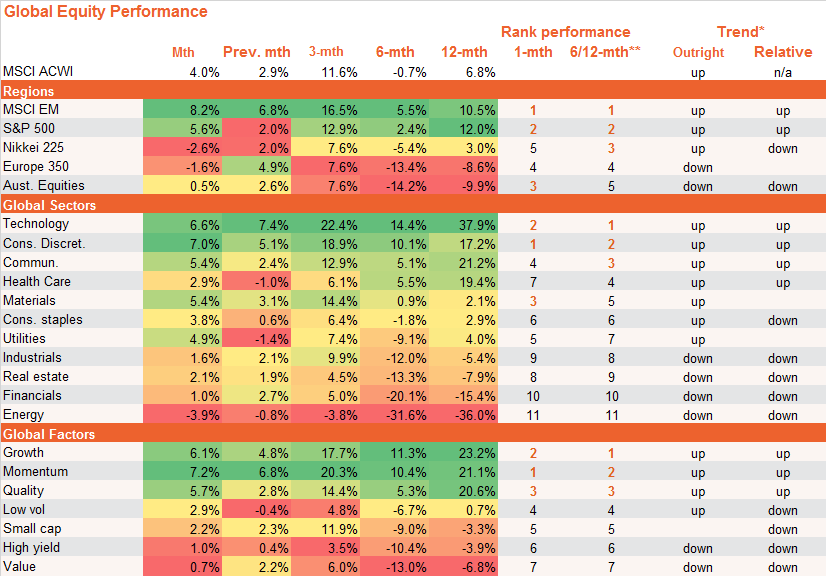
Despite still-rising COVID-19 cases globally – and signs of a tempering in the economic rebound – the V-shaped global equity recovery continued into July. The MSCI All-Country World Equity Return Index rose by 4.0% in local currency terms, after a gain of 2.9% in June.Chief economist David Bessanese from BetaShares summarises the monthly trends in their video below.
 Watch on YouTube — Watch on YouTube
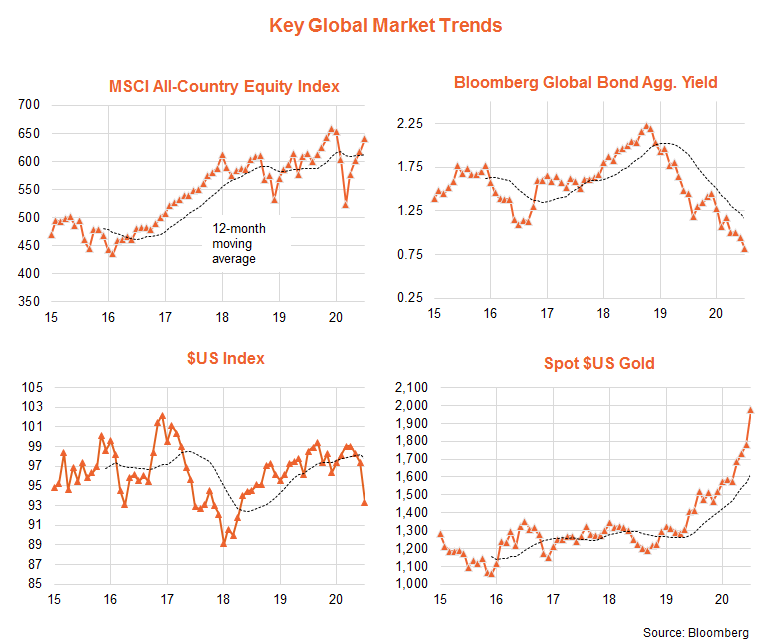
 Equity investors remain hopeful due to ongoing monetary support, tech sector resilience, vaccine hopes and avoidance (so far at least) of a return to widespread lockdowns in much of the developed world. The Q2 U.S. earnings reporting season is also, so far at least, not as bad as feared. The influence of U.S. monetary stimulus remains evident in other markets, with a further easing in the $US and bond yields during July, and further gains in gold.
As seen in the chart set below, global bond yields and the $US remain in a downtrend, and gold prices in an uptrend. While global equities are presently above their 12-month moving average, they’ve been in a choppy broad sideways range since early 2018.
Global equity fundamentals – counting on low bond yields and stabilisation in earnings expectations
The rebound in global equities of late has largely been driven by a rebound in PE valuations, though in July forward earnings also ticked up, reflecting a stabilisation in earnings growth expectations after recent sharp downgrades.
The fundamental picture for equities remains mixed. On an outright basis, PE valuations remain well above long-run average levels, though relative to current low bond yields the market is less obviously expensive – the equity-to-bond yield gap is only modestly below the average of recent years and still comfortably above 20 to 50 year average levels. As regards earnings, there is also scope for further gains in forward earnings if there are no further downgrades to the earnings outlook for 2020 or 2021 in coming months – though this seems unlikely given the strong (30%) bounce-back still expected next year.

Key global equity trends
As seen in the table below, among key regions, emerging markets have enjoyed relatively strong gains in recent months (likely helped by a weaker $US) followed by the U.S. Technology and consumer discretionary stocks continue to perform relatively well at the sector level, while growth, momentum and quality remain the leading global factor exposures.
Among the global currency-hedged and domestic equity funds, the top relative performers remain global gold miners, followed by Australian technology and global health care. Among global unhedged equity funds, the strongest performers were Asian technology, the NASDAQ 100 and global robotics and artificial intelligence.
Cash and bonds – government yields drop, credit spreads widen
In the local bond market, overall bond yields plumbed new lows in July and credit spreads contracted further (though remaining a little above their lows earlier this year). As a result, fixed-rate bonds continued to outperform cash, especially longer-duration corporate exposures. Narrowing credit spreads also supported hybrids and floating-rate bonds over cash.
 Source: Bloomberg. Past performance is not indicative of future performance of the index or fund. You cannot invest directly in an index. Index performance doesn’t take into account any fund fees and costs.
*Trend: Outright trend is up if the relevant NAV return index is above its 12-month moving average and the slope of the moving average is positive, and down if the index is below this moving average and the slope of the moving average is negative. No trend is displayed in all other cases. Relative trend is based on the ratio of the relevant return index to its broader Australian or global benchmark index.
**The ranking of performance is based on an equally-weighted average of 6 & 12 month return performance.
Next Steps
To find out more about navigating current market trends speak to us to get you moving in the right direction.
This article was produced with the help of BetaShares, click here to view the full article.
Important information and disclaimer
The information provided in this document is general information only and does not constitute personal advice. It has been prepared without taking into account any of your individual objectives, financial solutions or needs. Before acting on this information you should consider its appropriateness, having regard to your own objectives, financial situation and needs. FinPeak Advisers does not provide personal tax, legal or accounting advice. This material has been prepared for informational purposes only, and is not intended to provide, and should not be relied on for, tax, legal or accounting advice. You should consult your own tax, legal and accounting advisors before engaging in any transaction. You should read the relevant Product Disclosure Statements and seek personal advice from a qualified financial adviser. From time to time we may send you informative updates and details of the range of services we can provide.
FinPeak Advisers ABN 20 412 206 738 is a Corporate Authorised Representative No. 1249766 of Aura Wealth Pty Ltd ABN 34 122 486 935 AFSL No. 458254 (a subsidiary of Spark Financial Group ABN 15 621 553 786)