
Asset Class Performance – Trade tensions rising
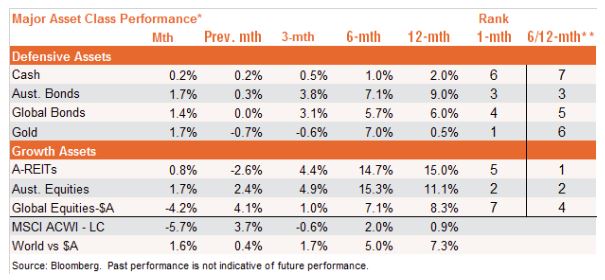
Gold the best performing of our seven major asset classes* in May, while Australian equities also posted good returns. The resumption of trade tensions between the US And China saw equity markets pull back from April's strong performance, this had flow-on effects to other parts of the market with the MSCI All Country index posting negative returns for the month.https://youtu.be/X8y3W3wbwqY
Key Market Trends
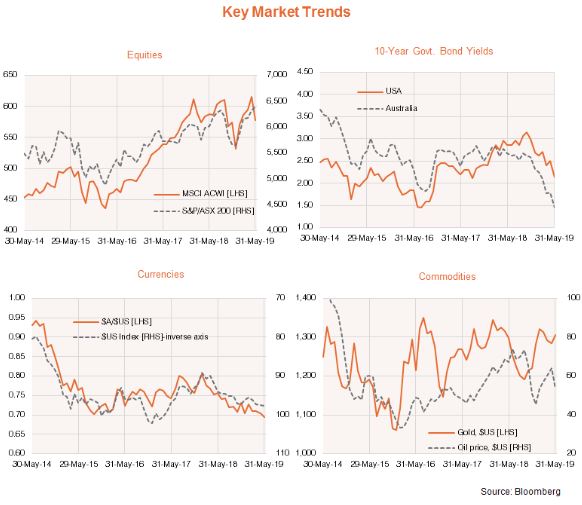
A resumption of US-China trade tensions saw global equities pull back in May, with the MSCI All-Country World Index declining by 5.7% in local currency terms. As seen in the chart below, this continues the broadly choppy performance of equity markets since early 2018, reflecting the interaction of slowing global growth and trade fears, yet subdued inflation and an increasingly benign interest rate environment. Indeed, bond yields continued to trend lower in May, while the “safe-haven” $US remained firm. Commodity price performance also remained choppy, with May’s risk-off sentiment helping gold prices, but not oil prices.
Asset Class Performance – Aussie equities withstand global sell-off
In unhedged Australian dollar terms, global equities declined by a somewhat smaller 4.2% in May, reflecting strength in global currencies versus the Australian dollar. Contrary to the global sell-off, however, Australian equities produced a feisty 1.7% gain, which was similar to the gains by “safer-haven” asset classes like Australian bonds and gold. Strength in iron-ore prices, a post-Federal election relief rally, heightened expectations of an RBA rate cut and a weaker Australian dollar all contributed to the local equity market’s strength.
Market Fundamental Outlook
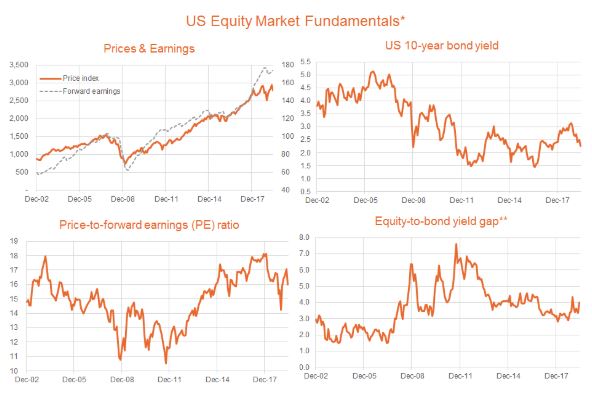
At face value, US equity valuations remain at reasonable levels. May’s sell-off in equities saw the US S&P 500 price-to-forward earnings ratio decline from 17 to 16 – leaving it comfortably within its range over the past few years. With declining bond yields, the US equity-to-bond yield gap is also back to around the average rate over the past few years.
Current earnings expectations imply 12-month growth in US forward earnings of around 10%. Allowing for modest further downgrades, my base case is for 12-month US earnings growth of 5%.
The biggest risk to equity markets is not valuation per se, but escalating trade tensions, which could further slow global growth and earnings. While the US Federal Reserve seems increasingly inclined to cut interest rates if trade tensions escalate further, the net effect of trade woes and lower US interest rates might well still be negative for equity markets.
While the outcome of the US-China trade dispute remains unclear, my base case view is that a trade truce will ultimately be reached before it leads to a serious dent in the global growth outlook – if only because this could threaten US President Trump’s re-election chances next year. That said, even if a more serious trade war is averted, the prospect of only modest earnings growth and an eventual back-up in bond yields suggests only modest equity gains would be likely under even a best case scenario.
All this suggests a growing level of caution around equities may be warranted this year, with increasing focus on defensive thematics such as quality, and areas of the market such as health care and property/utilities. In Australia, subject to the trade wars, a still generally improving outlook for China should favour the resources sector, while the RBA’s easing bias favours yield-sensitive sectors such as property and infrastructure.
*Asset Benchmarks Cash: UBS Bank Bill Index; Australian Equities: S&P/ASX 200 Index; Australia Bonds: Bloomberg Composite Bond Index; Australian Property: S&P/ASX 200 A-REITs; International Equities: MSCI All-Country World Index, unhedged $A terms; Gold, Spot gold price per tonne in $US.
** 6/12 month momentum rank based on equally-weighted average of 6 & 12 month return performance.
***Outright trend is up if the relevant NAV return index is above its 12-month moving average and the slope of the moving average is positive. Relative trend is based on the ratio of the relevant return index to its broader Australian or global benchmark index.
This article was produced by David Bassanese from BetaShares, you can read the full article here.
If you would like to know more, talk to Michael Sik at FinPeak Advisers on 0404 446 766 or 02 8003 6865.
Important information and disclaimer
The information provided in this document is general information only and does not constitute personal advice. It has been prepared without taking into account any of your individual objectives, financial solutions or needs. Before acting on this information you should consider its appropriateness, having regard to your own objectives, financial situation and needs. You should read the relevant Product Disclosure Statements and seek personal advice from a qualified financial adviser. From time to time we may send you informative updates and details of the range of services we can provide. If you no longer want to receive this information please contact our office to opt out.
FinPeak Advisers ABN 20 412 206 738 is a Corporate Authorised Representative No. 1249766 of Aura Wealth Pty Ltd ABN 34 122 486 935 AFSL No. 458254