
21 Aug Market Commentary – August 2019
Asset Class Performance – bonds still driving equities
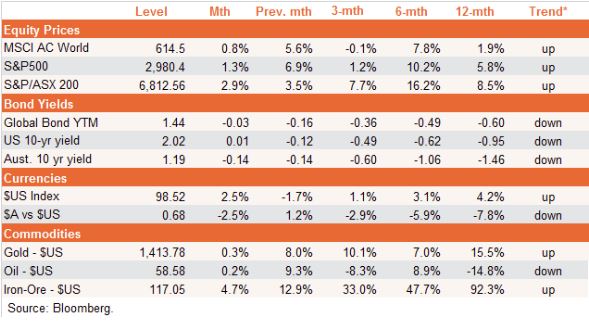
There were more modest moves in global financial markets over July, with earlier aggressive expectations of US Federal Reserve interest rate cuts tempered somewhat by signalling from the Fed. US-China trade tensions also continued to linger while markets braced for the Q2 US earnings reporting season.
US 10-year bond yields were steady and the $US lifted by 2.5%. The S&P 500 rose a more modest 1.3% after a strong 6.9% gain in June. Global stocks rose 0.8%.
In Australia, the RBA cut rates for the second successive month and signalled it was prepared to do more to boost growth and inflation. Local bond yields and the $A dropped notably, while the S&P/ASX 200 – also helped by stronger iron-ore prices – posted a solid 2.9% gain.
In terms of major trends, equities, gold and iron-ore are still pointing up while bond yields, the $A and oil are still pointing down. The $US’s gain in July saw its trend indicator turn positive.
Asset Class Performance – gold shines as $US weakens
Supported by stronger iron-ore prices and falling local interest rates, Australian equities were the best performing of our seven major asset classes in July, returning 2.9%. Falling bond yields allowed A-REITs to produce another good return of 2.6%, followed by unhedged global equities (2.2%). Bonds produced positive, but more modest, returns – along with gold.
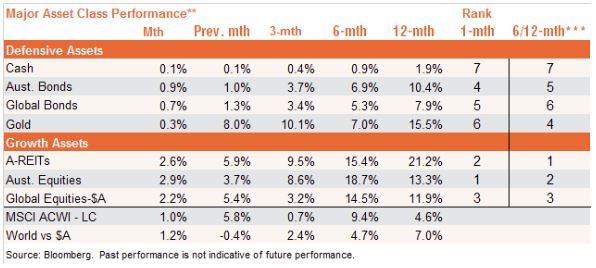
Across the seven benchmark asset classes we track, growth assets are still generally outperforming defensive assets in terms of momentum rank**, with Australian listed property (A-REITs) and Australian equities outperforming global equities. Among defensive assets, gold retains the strongest relative performance rank – while cash is no longer ‘king’ and has the worst relative performance rank of all the asset classes.
Market Fundamental Outlook
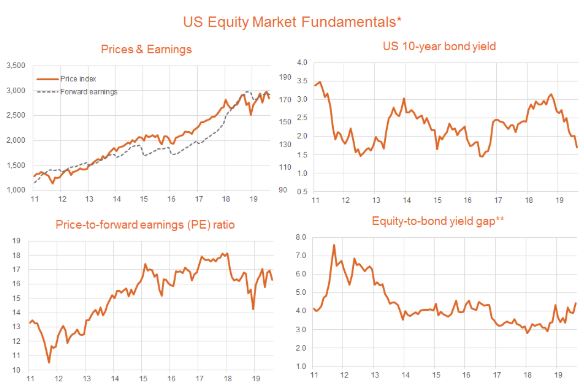
Hopes of aggressive central bank action and a ceasefire in the US-China trade war have supported equity markets in recent months. With relatively flat forward earnings growth, this pushed the S&P 500’s forward PE ratio to a reasonably lofty 17 by end-July. That said, falling interest rates remained supportive of valuations given that the US equity-to-bond yield gap also pushed higher, to be in the upper half of its range of recent years.
Given this relative value, if bond yields stay reasonably low, there’s scope for equity prices and valuations to continue to ‘melt up’. US earnings growth should also continue to grind modestly higher. All up, my base case of modest global growth and low global inflation continues to bode well for equities.
One concern remains a major back-up in bond yields, especially if the US Fed signals a less aggressive stance toward rate cuts if the economy continues to hold up and/or wage inflation starts to stir. That risk appeared to be partly playing out following the Fed’s late-July rate cut – with Fed chair Powell telling markets not to expect a “long series of rate cuts”.
That said, bond yields quickly fell back following the ratcheting up in US-China trade tensions. Indeed, to some extent these two risks are offsetting – as heightened trade tensions would make it more likely that the Fed would cut interest rates further.
A further ratcheting-up in trade tensions would likely see equity markets weaken, even if the Fed lends further support. The concern is that trade tensions may now need to get worse – hurting both stocks and global growth – before both parties feel compelled to compromise and strike a deal.
Although this has been tested in recent days, my base case view remains that a trade truce will ultimately be reached before it leads to a serious global bear market or economic recession – if only because this could threaten US President Trump’s re-election chances next year.
*Trend: Outright trend is up if the relevant NAV return index is above its 12-month moving average and the slope of the moving average is positive, and down if the index is below this moving average and the slope of the moving average is negative. No trend is displayed in all other cases. Relative trend is based on the ratio of the relevant return index to its broader Australian or global benchmark index.
**Asset Benchmarks Cash: UBS Bank Bill Index; Australian Equities: S&P/ASX 200 Index; Australia Bonds:Bloomberg Composite Bond Index; Australian Property: S&P/ASX 200 A-REITs; International Equities: MSCI All-Country World Index, unhedged $A terms; Gold, Spot gold price per tonne in $US.
*** 6/12 month momentum rank based on equally-weighted average of 6 & 12 month return performance.
This article was produced by David Bassanese from BetaShares, you can read the full article here.
If you would like to know more, talk to Michael Sik at FinPeak Advisers on 0404 446 766 or 02 8003 6865.
Important information and disclaimer
The information provided in this document is general information only and does not constitute personal advice. It has been prepared without taking into account any of your individual objectives, financial solutions or needs. Before acting on this information you should consider its appropriateness, having regard to your own objectives, financial situation and needs. You should read the relevant Product Disclosure Statements and seek personal advice from a qualified financial adviser. From time to time we may send you informative updates and details of the range of services we can provide. If you no longer want to receive this information please contact our office to opt out.
FinPeak Advisers ABN 20 412 206 738 is a Corporate Authorised Representative No. 1249766 of Aura Wealth Pty Ltd ABN 34 122 486 935 AFSL No. 458254
No Comments