
24 Mar An Update: The Impact of COVID-19 so far
The economic impact of Coronavirus so far (as at 18.03.20)
An update on current market developments
Over the last few days, we have seen significant volatility across global financial markets reflecting heightened levels of investor uncertainty given the rapid spread of the coronavirus (COVID-19) and governments’ attempts to swiftly contain it.
The breakdown in relations between two major OPEC producers (Russia and Saudi Arabia), resulted in supply increases and a subsequent US$7–US$8 fall in the price of oil as the week began (a circa 20%–30% decline).
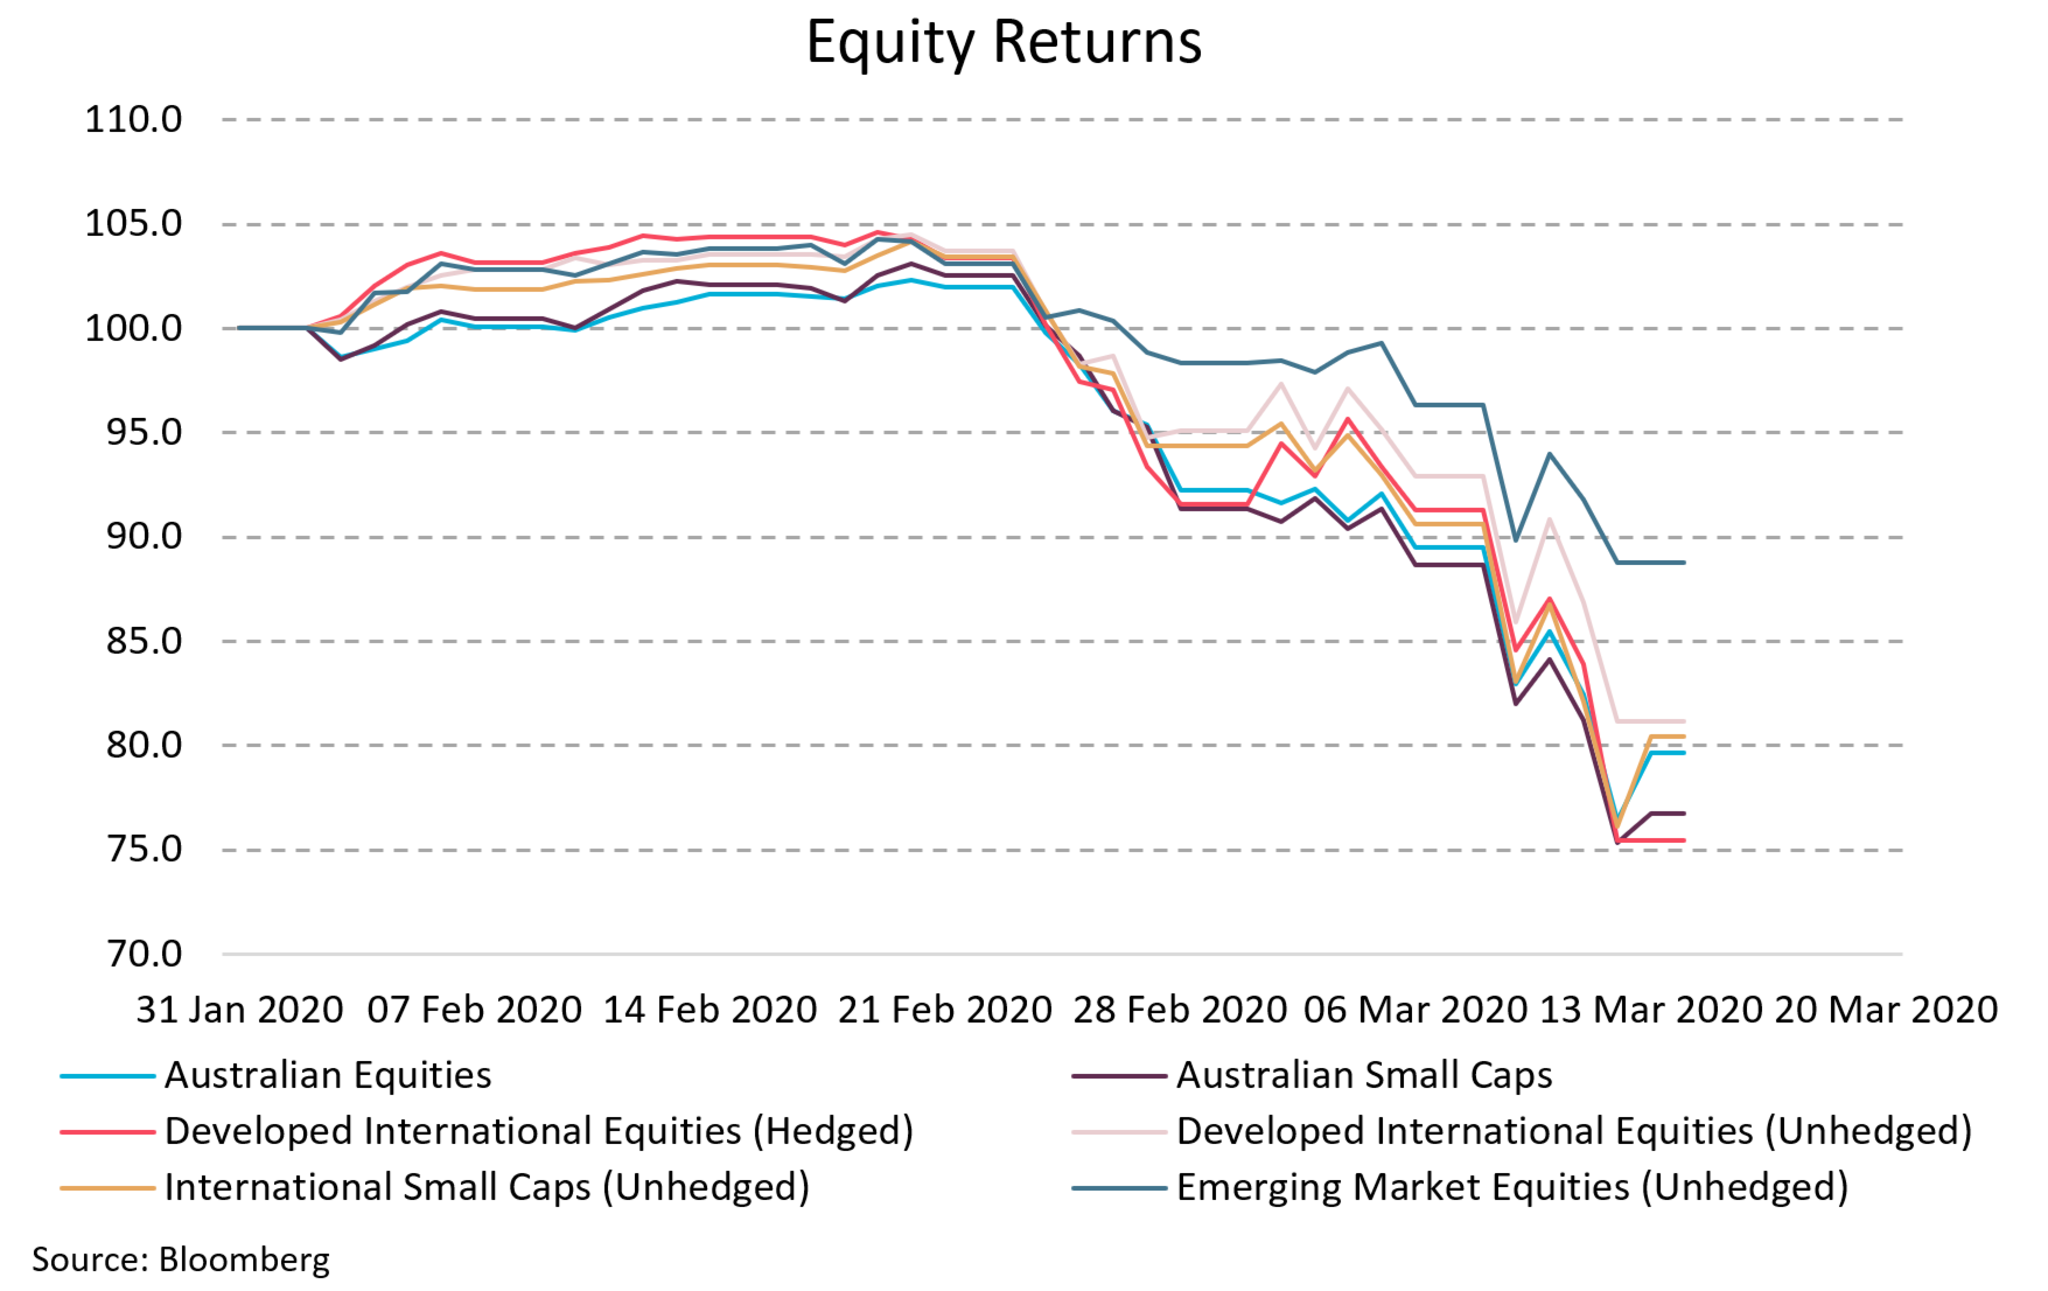
There were few safe assets for investors, with virtually all asset classes suffering a setback last week, including defensive assets such as US Treasuries and gold. Most major equity markets have now fallen between 15.0%–25.0% year to date.
Evidence of indiscriminate selling is being met with Central Banks cutting rates and increasing asset purchases through the re-enactment of quantitative easing (which helps stimulate spending when interest rates fail to work).
Figure 1: Asset market performances from 31 January to 13 March 2020
The most recent policy announcements have been decisive and significantly more coordinated:
- The Reserve Bank of New Zealand reduced interest rates by 0.75% to 0.25%.
- Bank of Canada cut interest rates for the second time in two weeks to 0.75%.
- US Federal Reserve slashed rates by 1.0% to a target range of 0.0%–0.25%, while also instigating fresh rounds of QE up to US$700bn of purchases across the Treasury and Mortgage-Backed Security markets.
- The German government has announced a EUR460bn (up to 10% of GDP) fiscal stimulus plan.
- The RBA has announced it will release further policy measures this coming week.
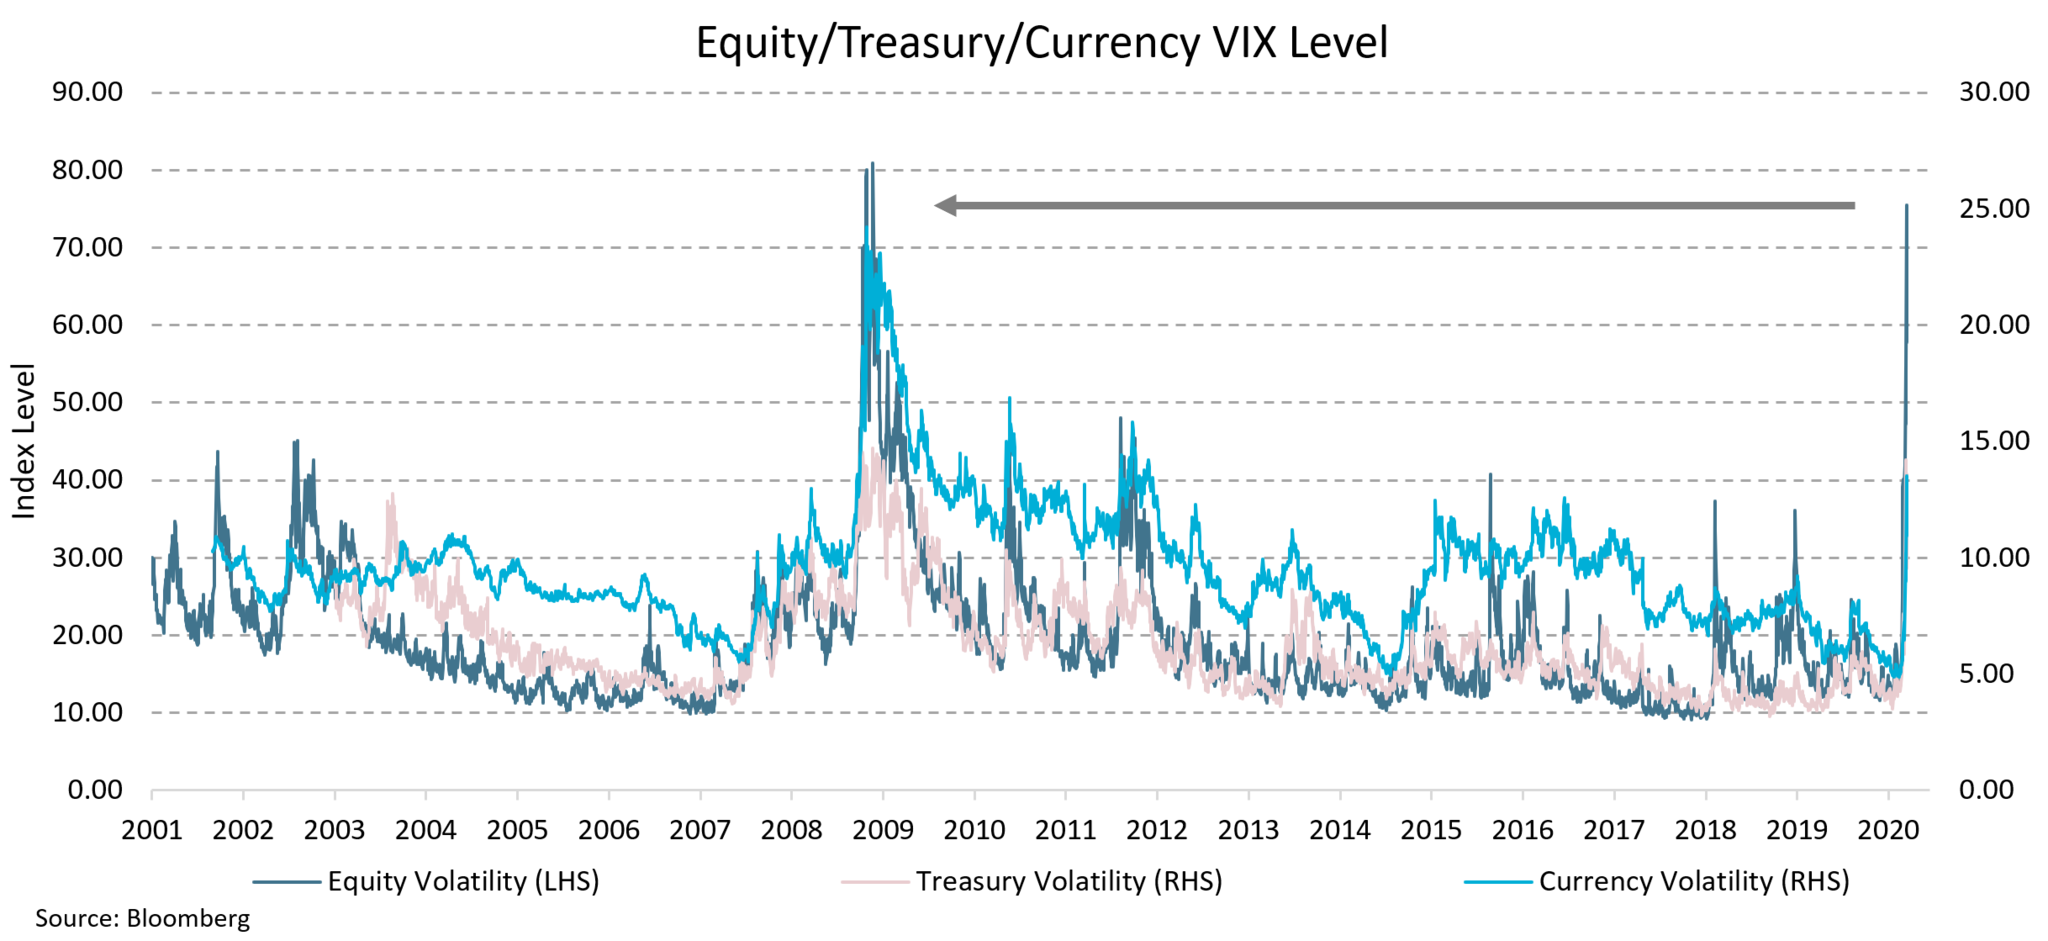
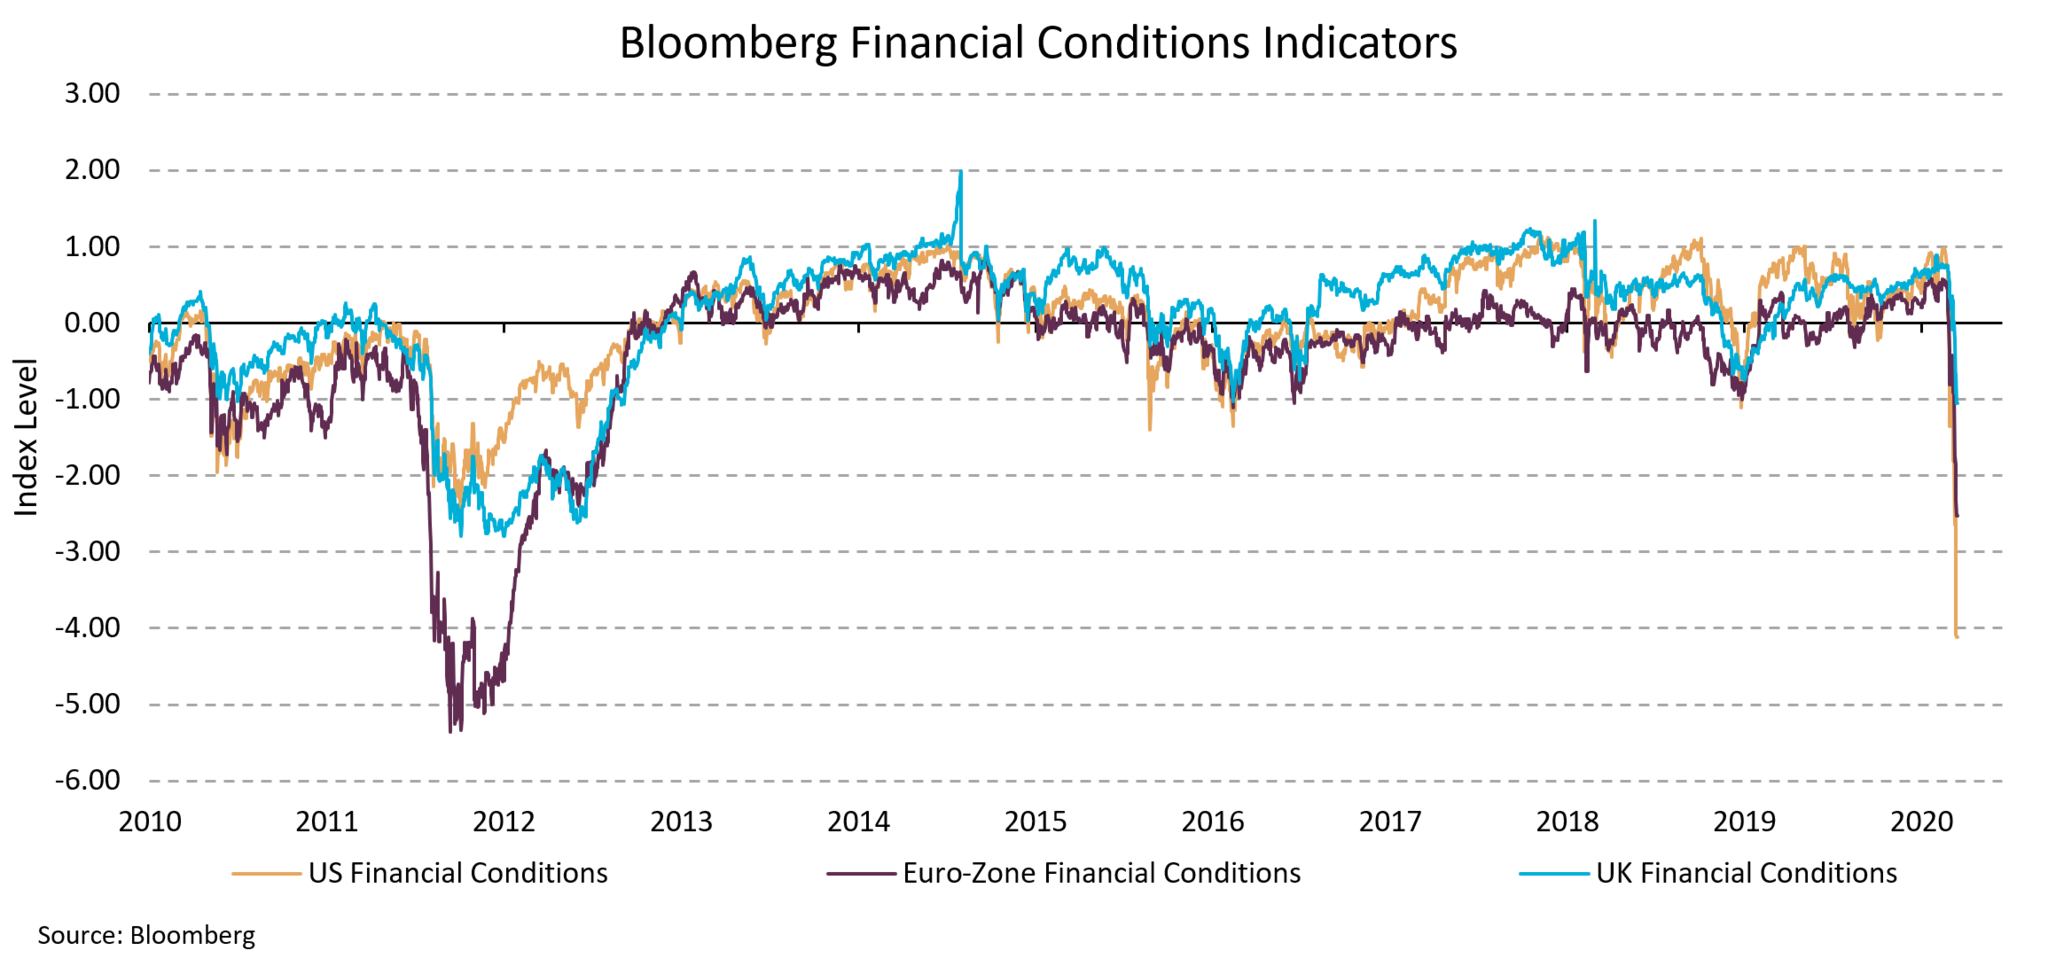
Aside from some early indications of deteriorating economic conditions, investors, governments and policymakers have had little bearing in assessing the potential economic implications from this pandemic. The current questions most concerning to investors include: ‘How steep will the fall in economic activity be?’ and ‘How long will it last?’ These unknowns have seen a significant rise in volatility and a deterioration in financial conditions, which largely pre-empted the policy responses outlined above.
Figure 2. Market volatility and financial conditions deteriorated back to 2008 levels
Portfolio diversification has helped limit the declines
Whilst most asset classes have suffered significant declines throughout March, portfolio diversification has helped insulate some of the volatility that investors have experienced in equity markets to date.
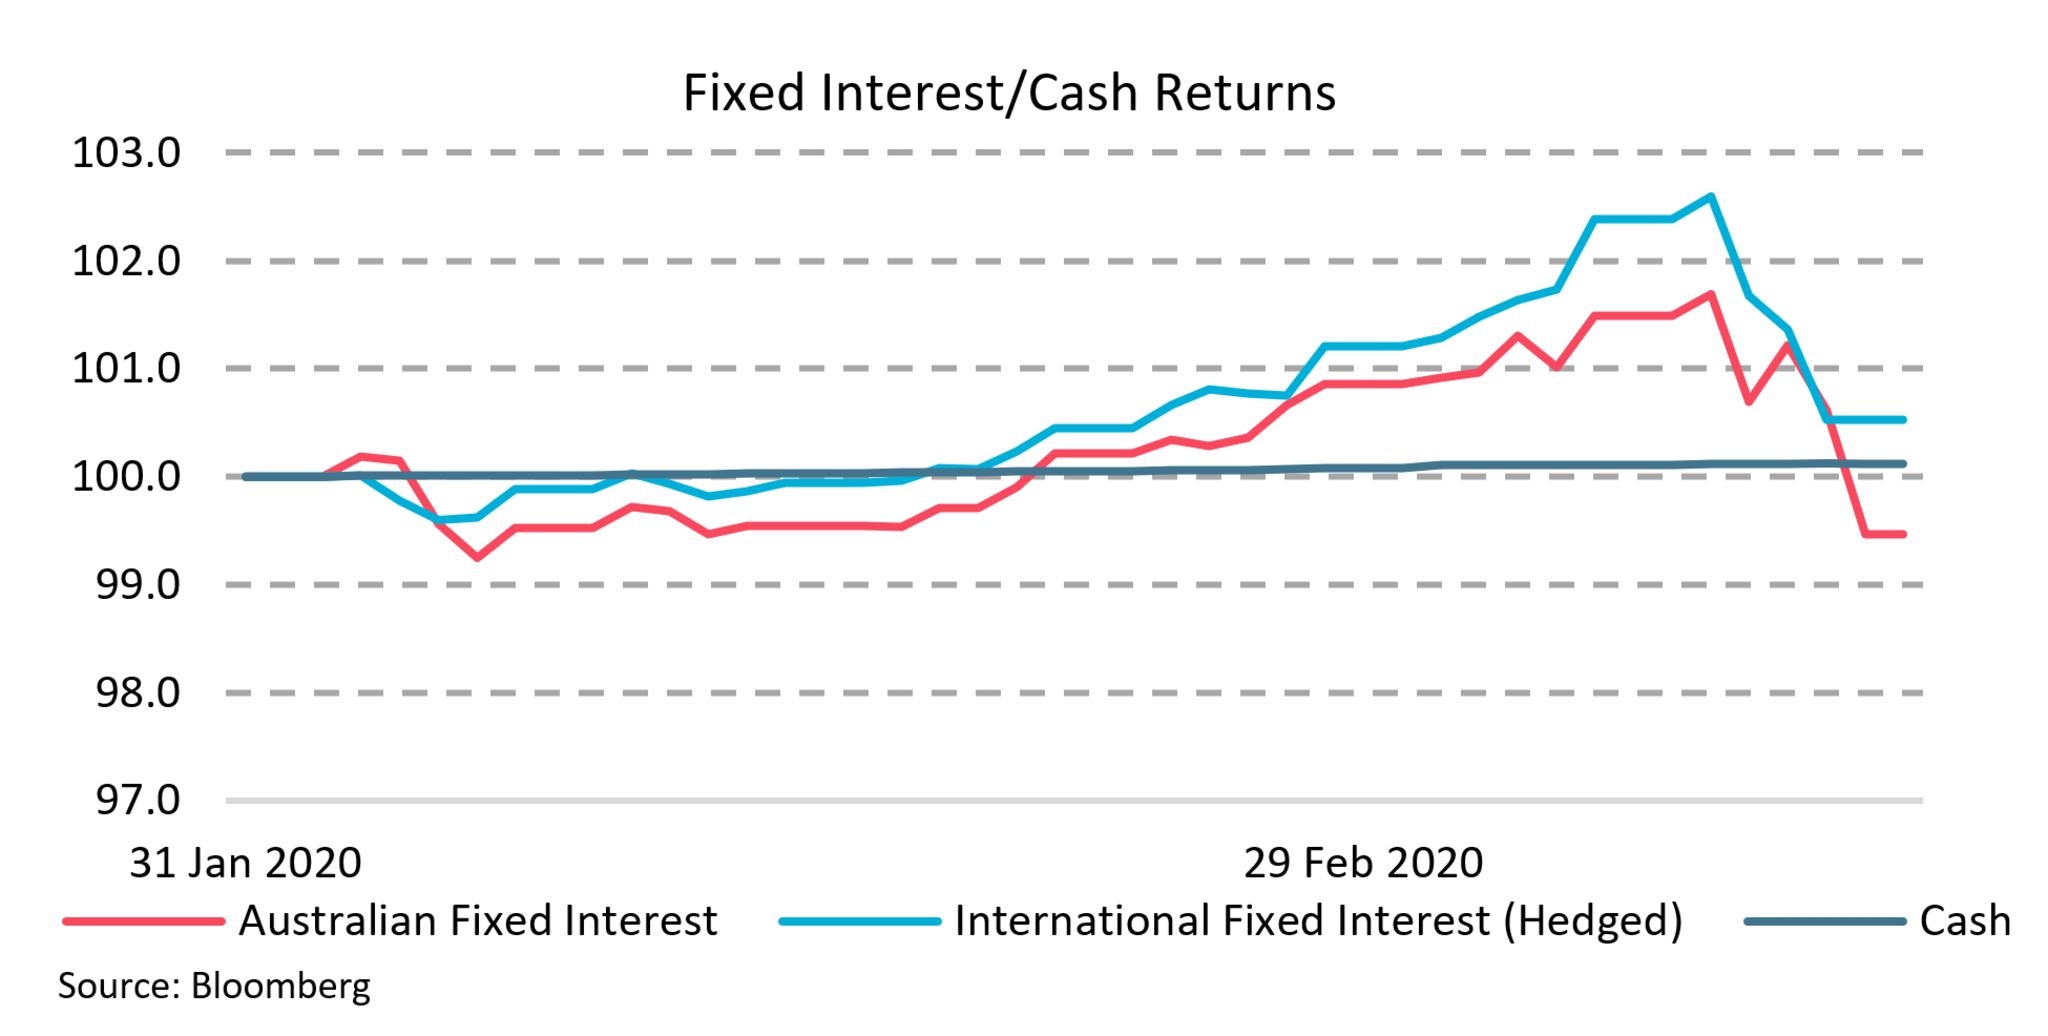
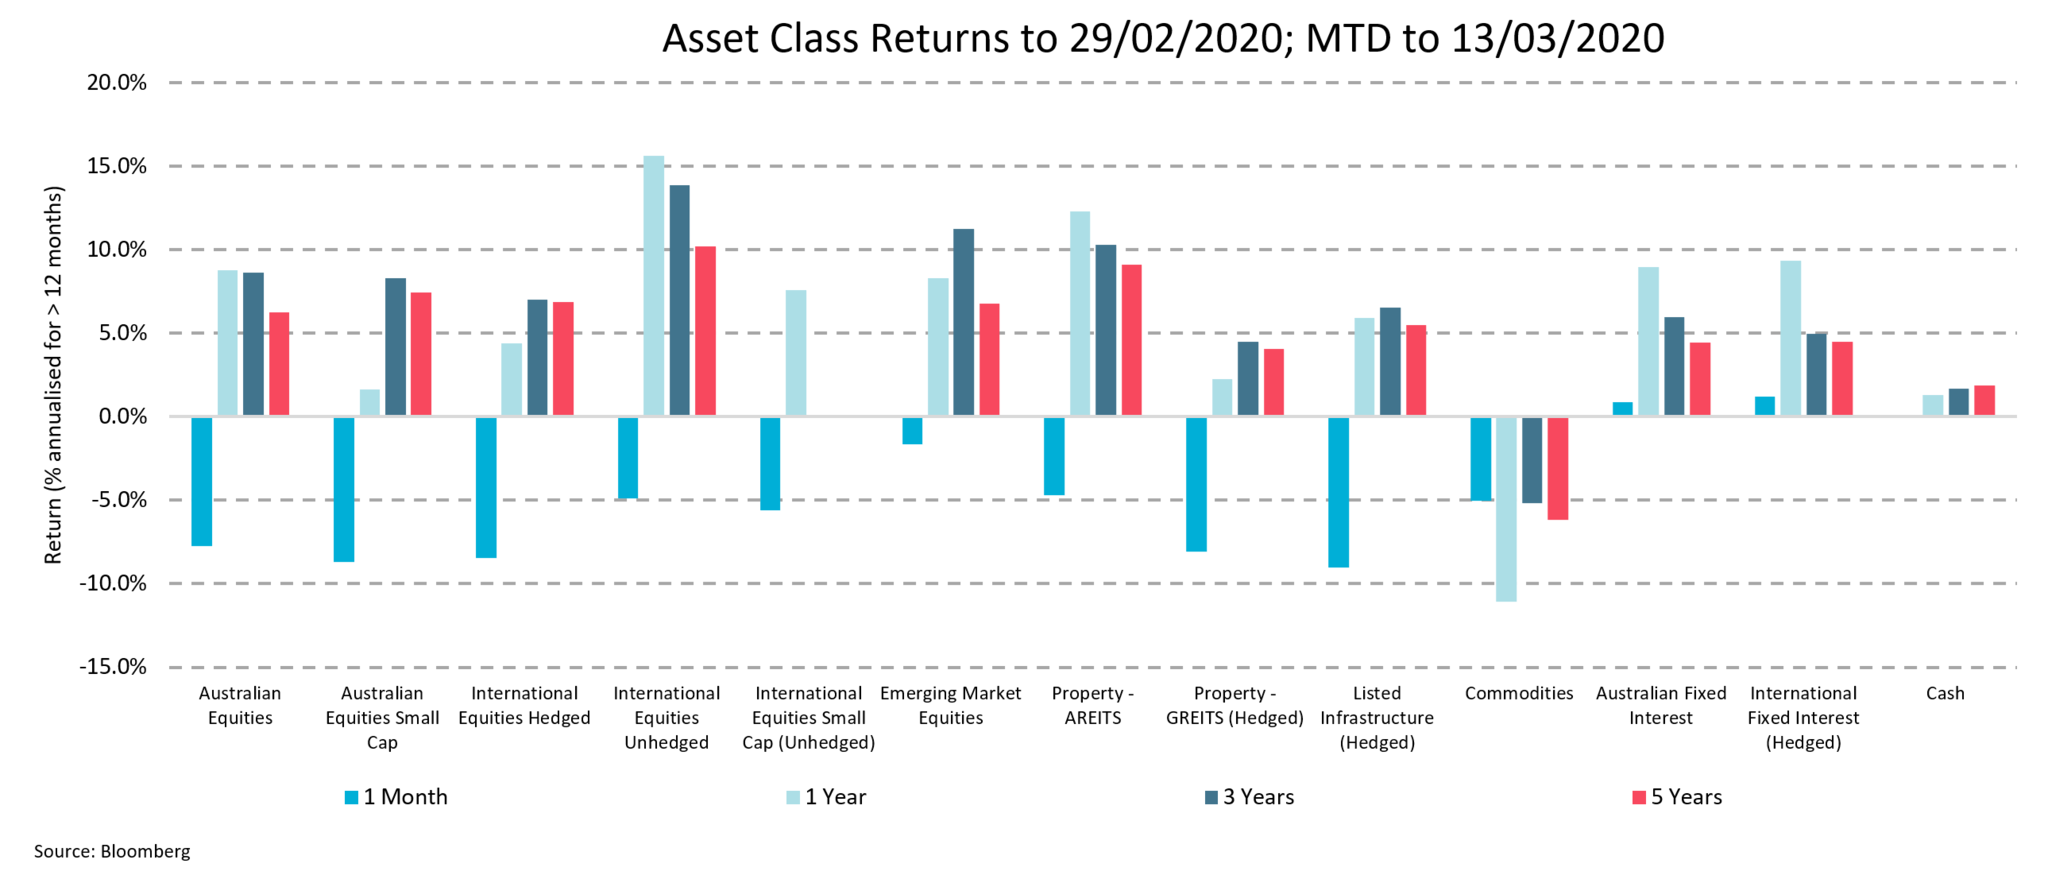
Despite most regional equity markets having declined more than -15.0% month to date, Emerging Market equities (AUD unhegded), which typically have a higher risk exposure, have only fallen -10%. Other low beta growth assets (REITs) have also provided some protection, while despite the sharp sell-off in oil prices, a more diverse basket of commodity exposures has fallen just -7.9%. Traditional defensive assets have fared much better with Australian Fixed Interest falling -1.4% while International Fixed Interest has declined -0.7%.
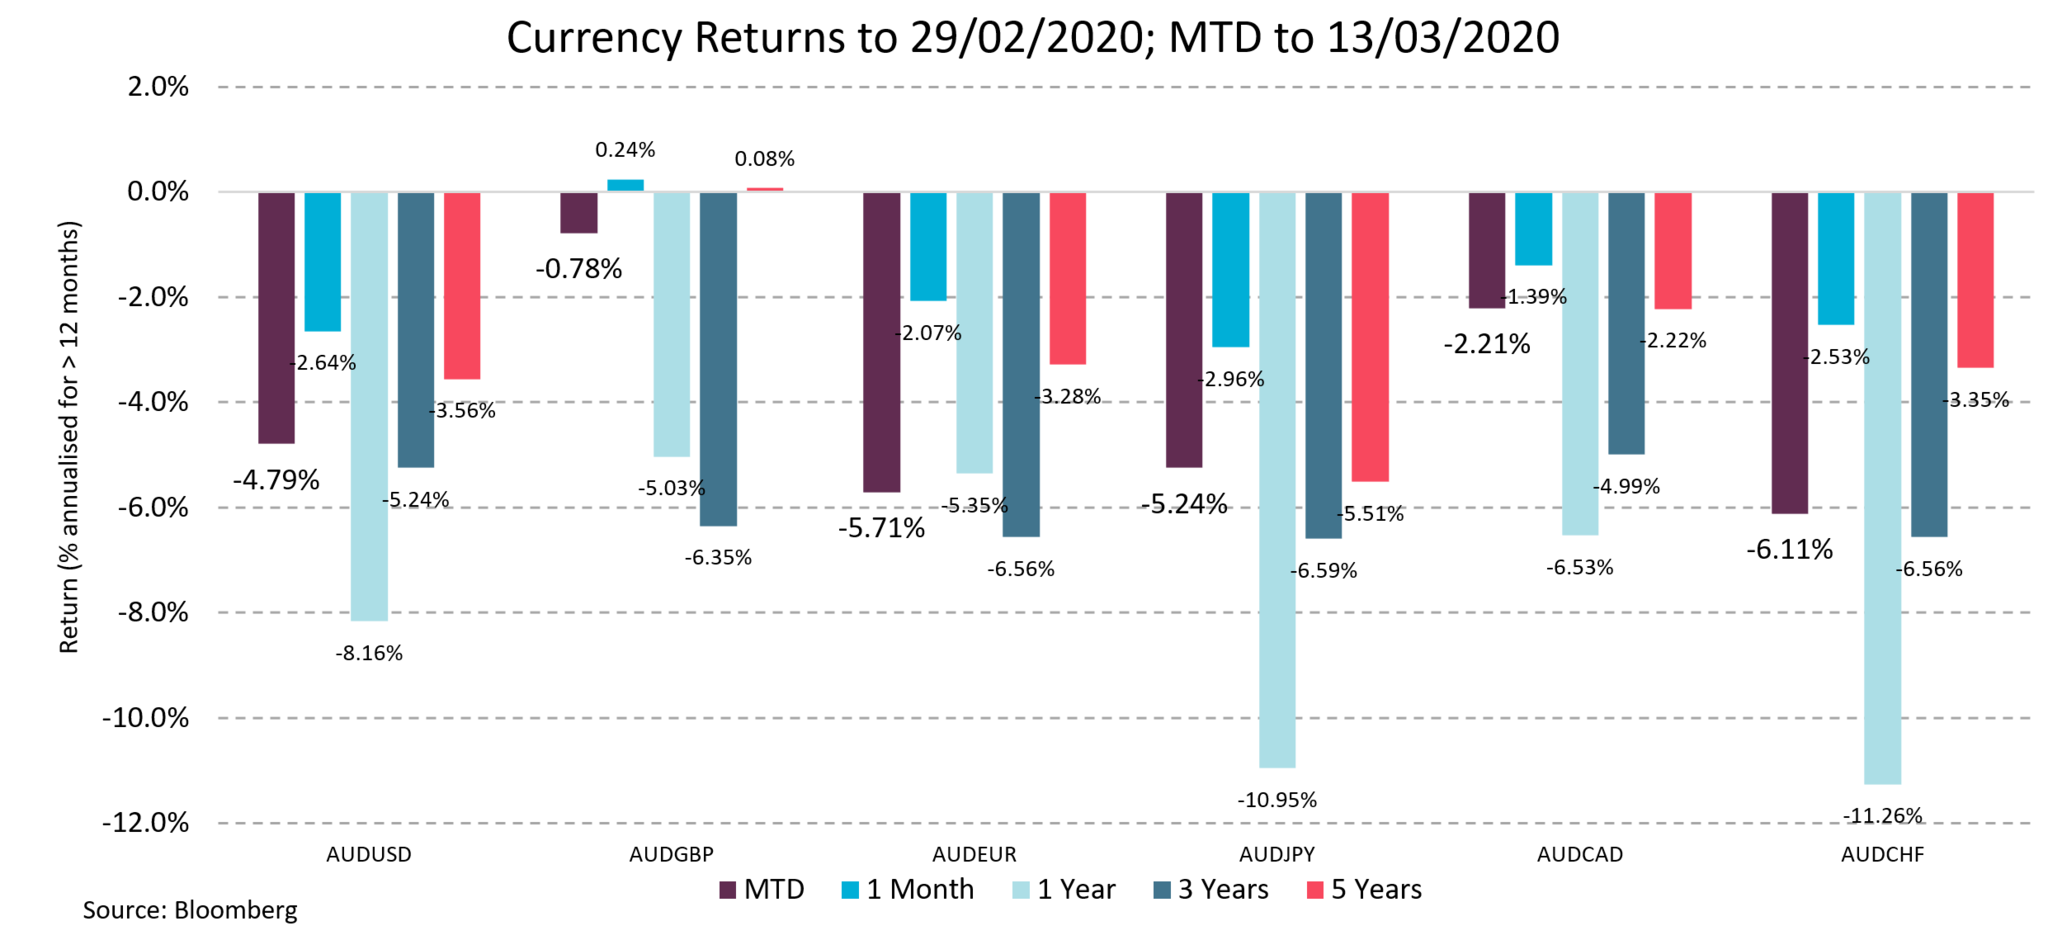
For domestic investors, having unhedged exposure to foreign assets has provided some much needed diversification as the Australian Dollar has declined near -5.0%. This has helped offset some of the declines particularly for investors with global equity exposures.
Figure 3. Asset class and currency returns
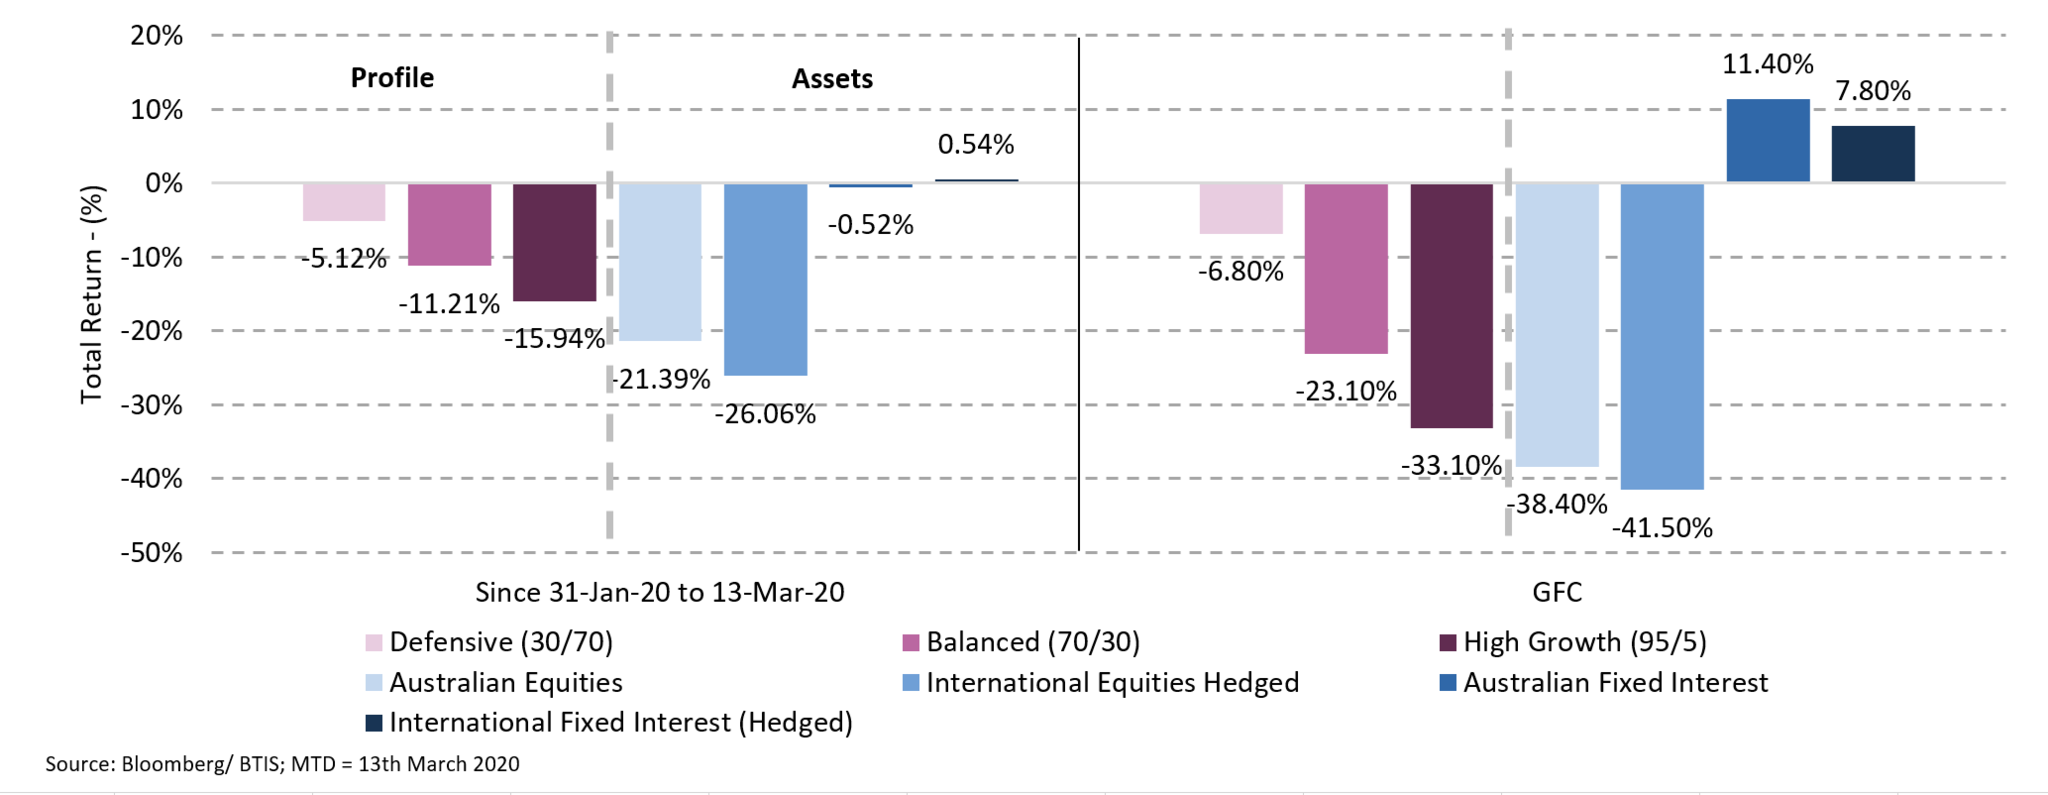
A typical Balanced Fund with a mix of 70/30 growth and defensive asset exposure, will have declined approximately -7.3% month to date. This has been significantly less than those declines experienced in Australian and International equity markets.
Considering the market highs reached in January and February, an indicative balanced fund has declined approximately -11.2% so far, which is half of what was witnessed during the 2008 GFC period where investor declines were closer to -23.1%.
By maintaining a diversified approach, investors are able to buffer against the current bouts of volatility being experienced.
Figure 4. Multi-period returns for an indicative diversified portfolio vs key asset markets (growth/defensive allocation)
Valuations are mixed and fundamentals are yet to react
The current pricing moves across equities and bonds have seen a sharp divergence in valuations, particularly in the long-term.
In price terms, the US equity market has now repriced back to slightly above the long-term average equity risk premium (ERP of 4.0%) to 4.3%, whilst US 10 Year Treasury Bonds have fallen to a record low of 0.7% (and now a negative real yield of -0.84%3).
These relative value levels between Equities and Bonds have not been seen since post the 2008 GFC. Current market pricing has already begun factoring in a decline in company earnings and economic growth, however, the range of potential outcomes remains very wide over the short term.
While we expect that this will not be a long-term sustained decline in earnings and that the equity markets will recover, it is likely that the spread of the virus and the actions taken by governments will have longer lasting implications for financial markets.
Figure 5. US – Equity Risk Premia now above long term average
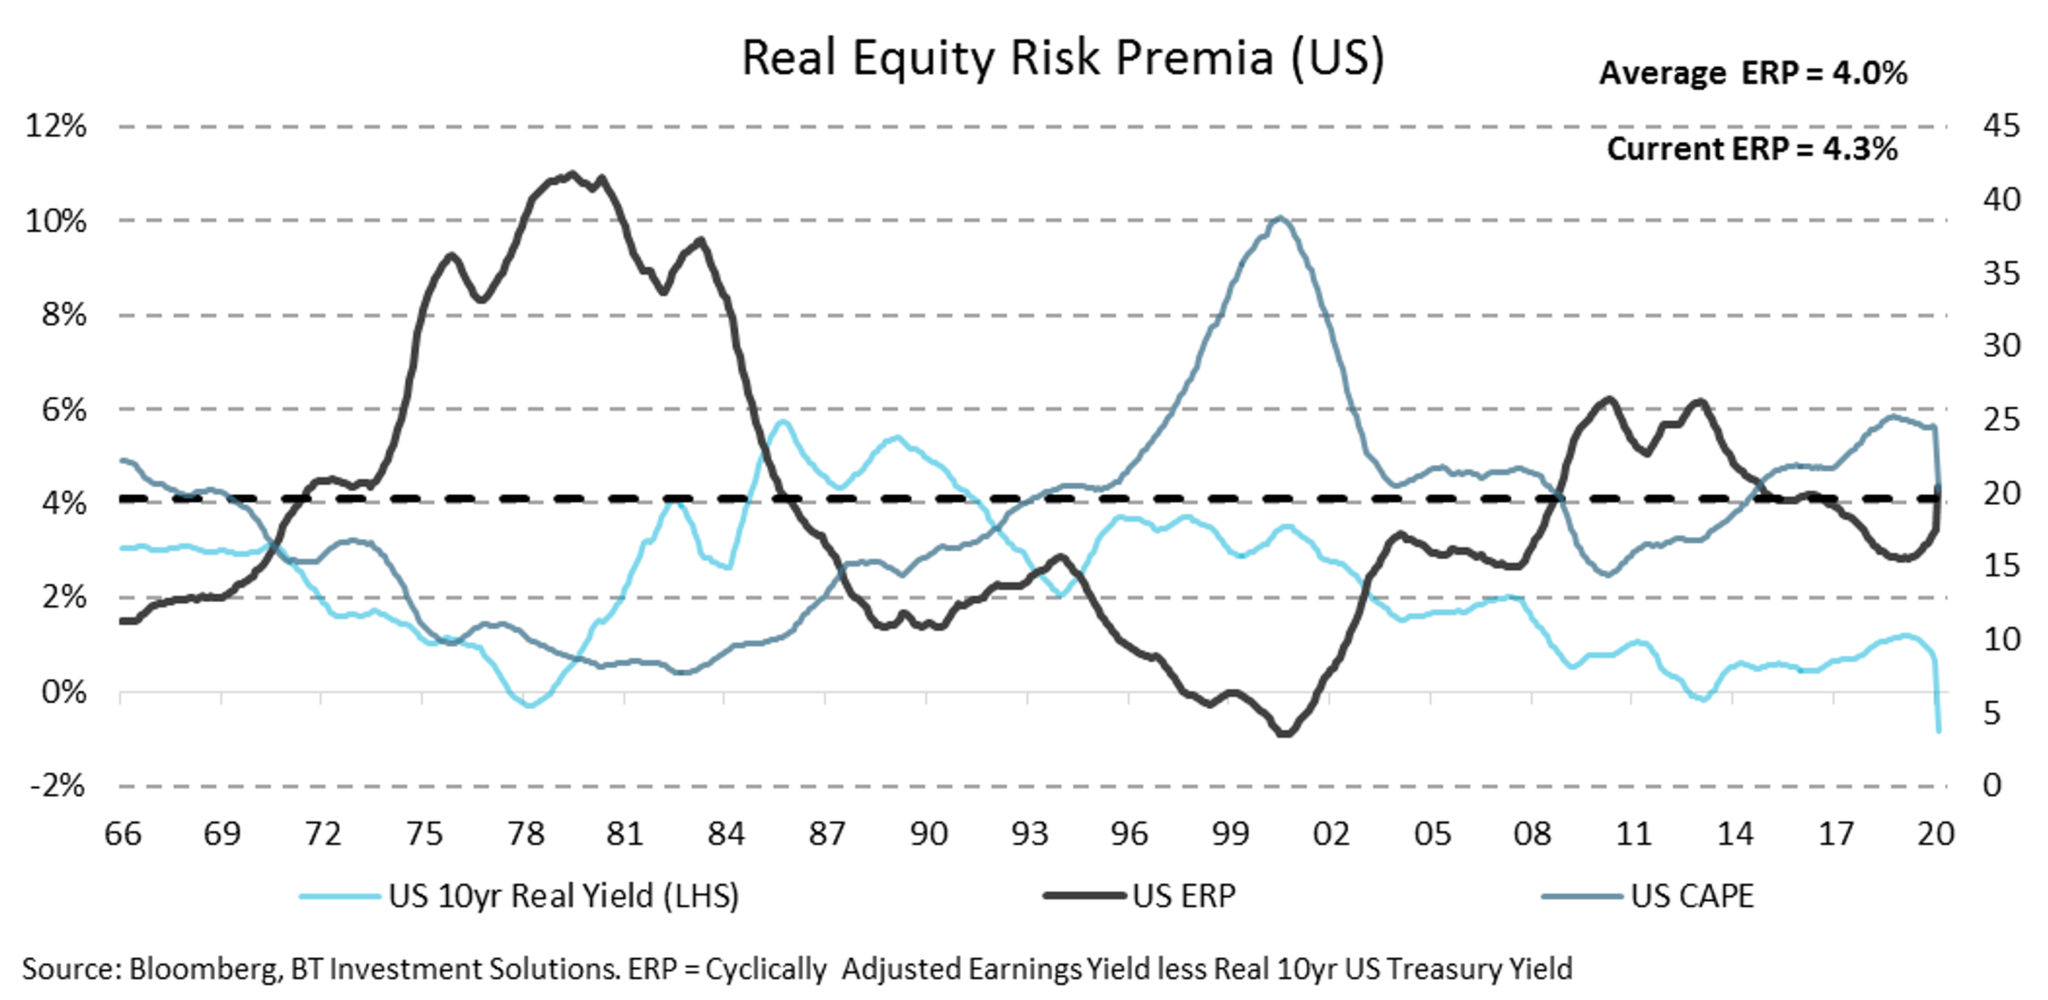
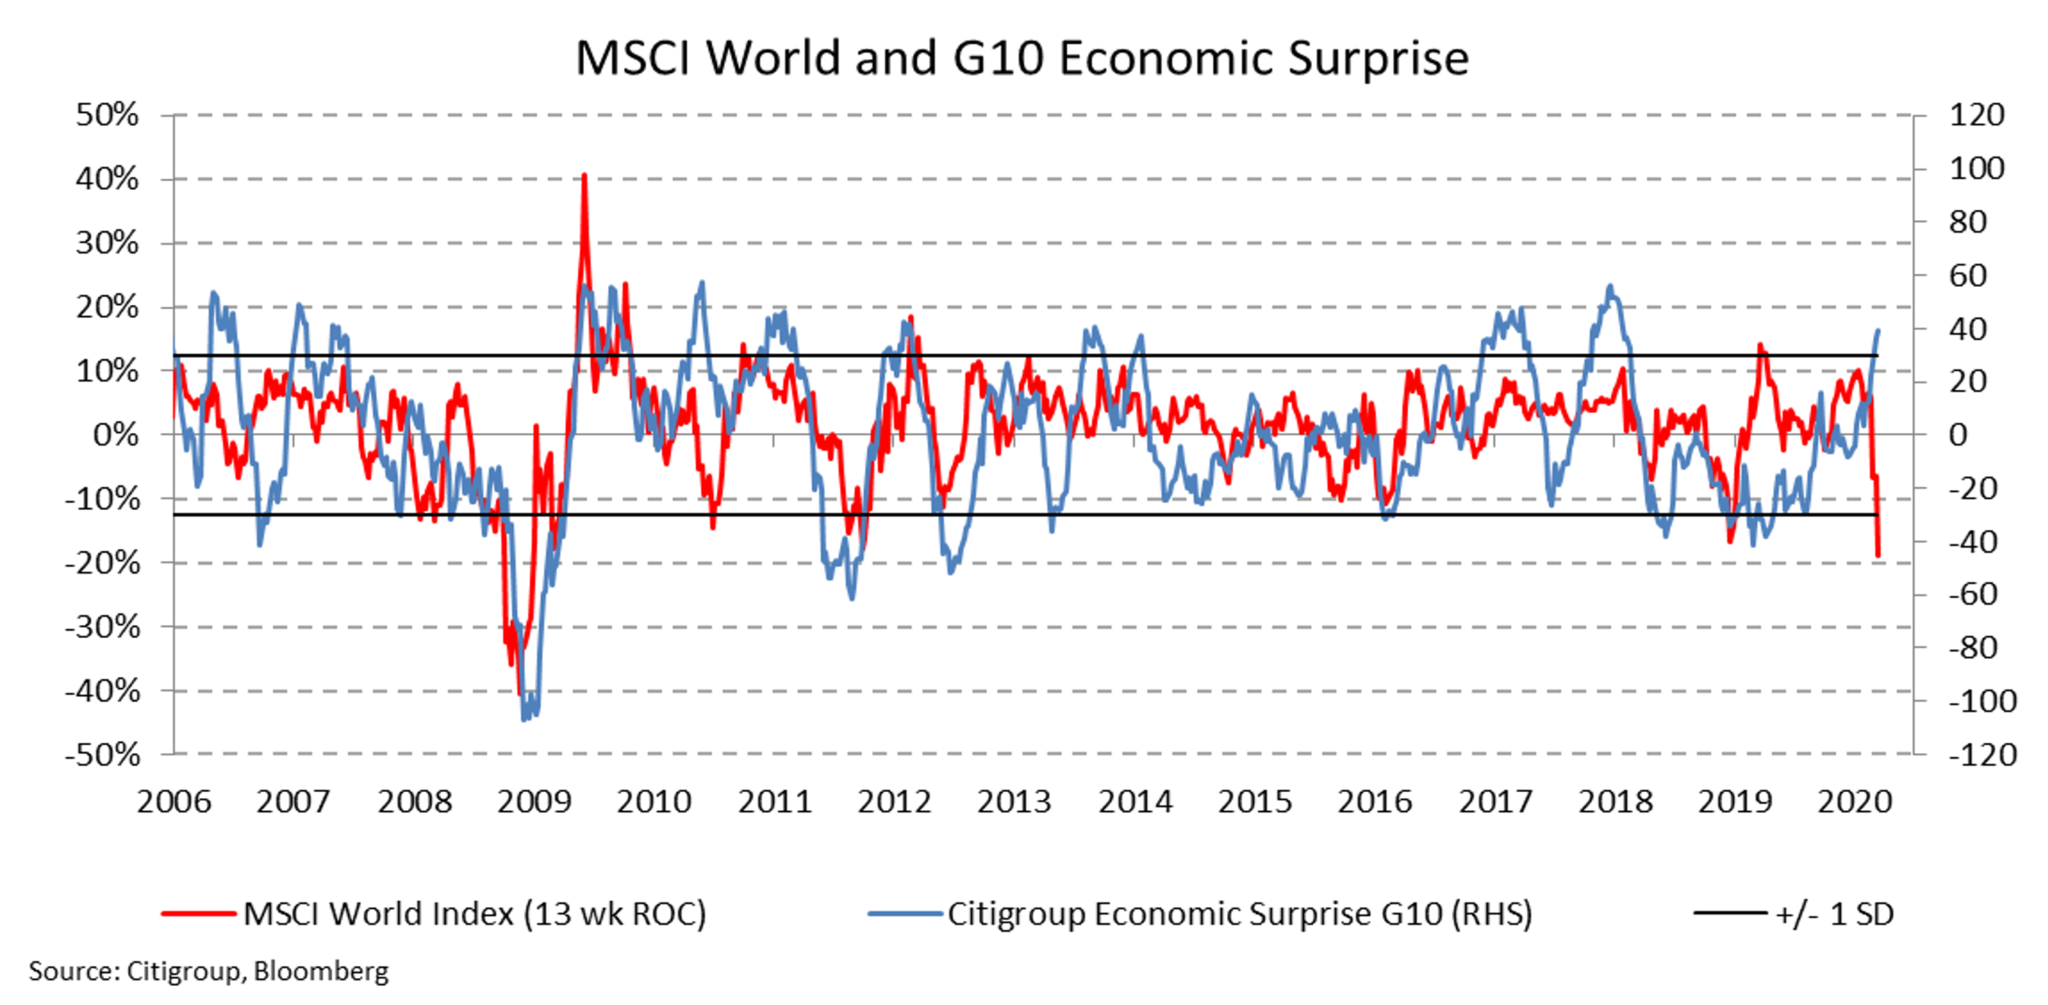
Figure 6. Economic data yet is to reflect current shift in pricing
If you would like to know more, talk to Michael Sik at FinPeak Advisers on 0404 446 766.
This article was produced with reference to BT (click here to view the full article).
Important information and disclaimer
The information provided in this document is general information only and does not constitute personal advice. It has been prepared without taking into account any of your individual objectives, financial solutions or needs. Before acting on this information you should consider its appropriateness, having regard to your own objectives, financial situation and needs. You should read the relevant Product Disclosure Statements and seek personal advice from a qualified financial adviser. From time to time we may send you informative updates and details of the range of services we can provide. If you no longer want to receive this information please contact our office to opt out.
FinPeak Advisers ABN 20 412 206 738 is a Corporate Authorised Representative No. 1249766 of Aura Wealth Pty Ltd ABN 34 122 486 935 AFSL No. 458254
No Comments